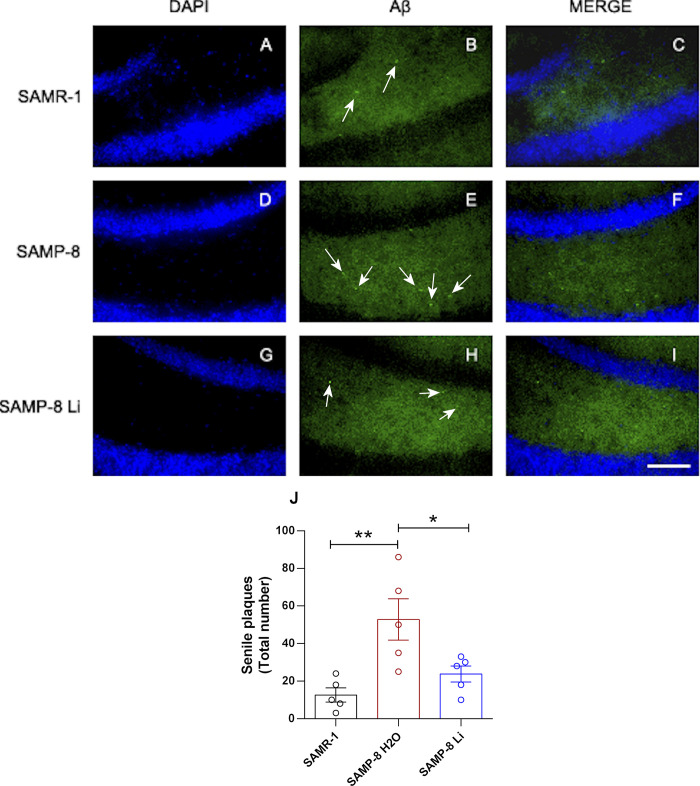
Fig 8. Senile plaques in the different animals’ hippocampus.
Labeling was done with Thioflavin-S 1% (green) in the hippocampus of SAMR-1 (A–C), SAMP-8 (D–F) and SAMP-8 Li (G–I). Cellular nuclei were labeled with DAPI (blue). Images were obtained using an inverted DMi8 microscope (Leica, Wetzlar, Germany) with a 20× objective. Scale bar: 100μm. J: Quantification of the total number of plaques in the hippocampus. Histograms and vertical bars are means ± SEM of samples from 5 animals per group. *: p < 0.05; **: p < 0.01.

