
Figure 2.
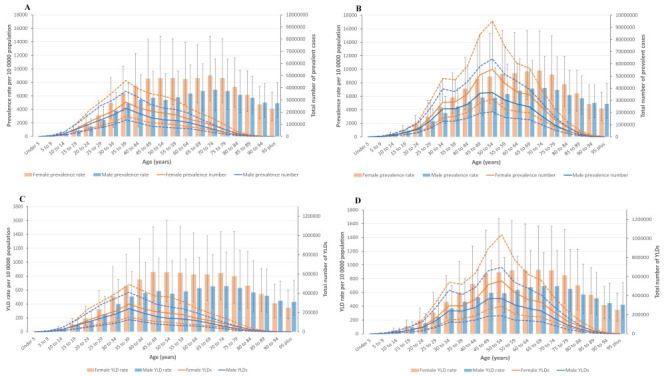
Age-standardised point prevalence (per 100 000 population) and number of prevalent cases by age and sex, 1990 and 2019, as well as age-standardised YLD rate (per 100 000 population) and number of YLDs by age and sex in 1990 and 2019. Dotted lines indicate 95% upper and lower UIs. Panel A and Panel C. 1990. Panel B and Panel D. 2019.