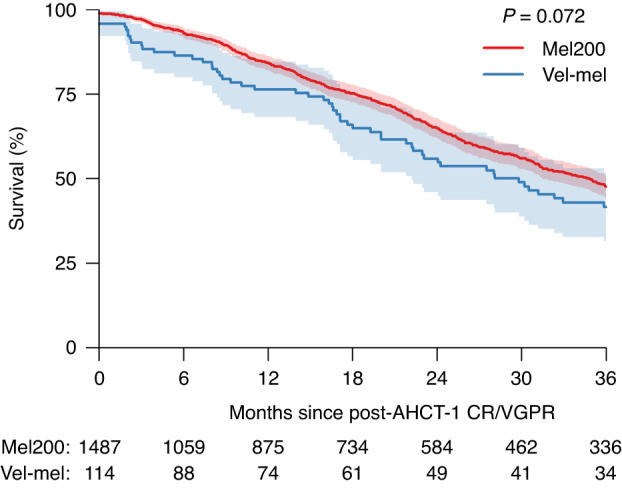
Fig. 3.

Kaplan-Meier curve of progression free survival after a best response of complete remission (CR) or very good partial remission (VGPR) after transplant (AHCT-1). Survival probabilities are represented as percentages, with the 95% confidence intervals indicated as shaded regions. The corresponding log-rank p-value is indicated in the plot. Below the time axis are the number of patients at risk at indicated timepoints, in each group.
