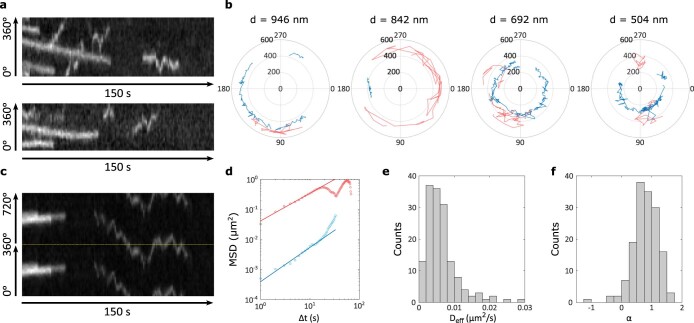
Extended Data Fig. 4. Diffusive motion of HT-PBP2B.
(a) Two example radial kymographs of HT-PBP2B (rich media, 30 °C) showing both processive and diffusive tracks. Diffusive tracks appear as short back-and-forth lines. (b) Examples of single-molecule tracks of HT-PBP2B across four septal diameters, plotted in polar coordinates. Tracks were produced using TrackMate36 with 0.5 µm linking distance and 0 frame gaps, then plotted in polar coordinates using bespoke MATLAB code. All processive and immobile tracks are shown in blue, while diffusive tracks are shown in red. (c) Example radial kymograph of HT-PBP2B (rich media, 30 °C) showing a processive track and a long-lived diffusive track. As the diffusive track covered most of the cell circumference, two revolutions around the cell (0°–360° and 360°–720°) are plotted top and bottom, separated by a dotted yellow line. (d) Example mean-squared displacement (MSD) vs. time step plot for the kymograph shown in panel c. Blue circles: MSDs from processive track. Red circles: MSDs from diffusive track. Blue line: fit to MSDs from processive track. Red line: fit to MSDs from diffusive track (fit details in Methods). (e) Histogram of effective diffusion coefficients from MSD analyses. (f) Histogram of anomalous diffusion exponents α from MSD analyses. Sample sizes are listed in Supplementary Table 6.

