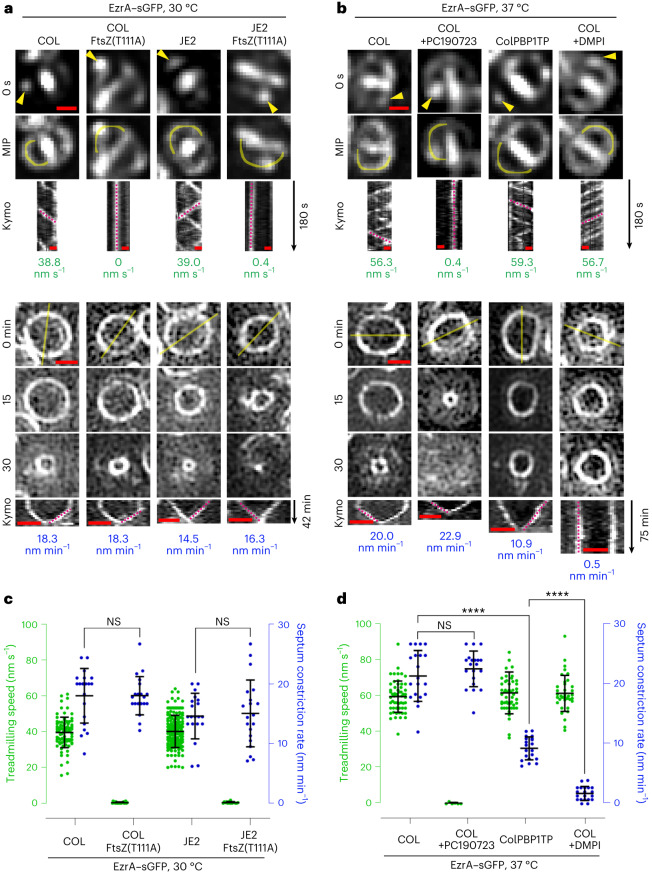
Fig. 1. Septum constriction is decelerated in cells lacking PBP1 TPase activity but not in cells with impaired FtsZ treadmilling.
a,b, Representative fluorescence micrographs of EzrA–sGFP in COL and JE2 backgrounds producing either FtsZ wild type or thermosensitive FtsZ(T111A) mutant variants at 30 °C (a), or in PBP1 TPase mutant ColPBP1TP and COL backgrounds at 37 °C in the absence and presence of FtsZ inhibitor PC190723 or MurJ inhibitor DMPI (b). Top: epifluorescence images of EzrA–sGFP in late pre-divisional cells with nascent Z-rings at the start (0 s) and throughout a 180-s time series (maximum intensity projection, MIP). Yellow arrow heads indicate EzrA–sGFP patches whose localization was followed over time. Space–time kymographs were generated by extracting fluorescence intensity values along indicated yellow freehand lines. Magenta dashed straight lines indicate slopes used to calculate EzrA–sGFP speed (nm s−1), a proxy for FtsZ treadmilling speed. Bottom: structured illumination microscopy images of constricting EzrA–sGFP rings. Magenta dashed straight lines in kymographs indicate slopes used to calculate septum constriction rates (nm min−1). Scale bars, 0.5 µm. c,d, Scattered dot plots of EzrA–sGFP speed (green) and Z-ring constriction rates (blue). Bars indicate means and standard deviations of slopes obtained from lines drawn on both types of kymographs of COL EzrA–sGFP (n1 = 83 and n2 = 20), COL EzrA–sGFP FtsZ(T111A) (n1 = 21 and n2 = 20), JE2 EzrA–sGFP (n1 = 171 and n2 = 20;) and JE2 EzrA–sGFP FtsZ(T111A) (n1 = 15 and n2 = 20) (c), and COL EzrA–sGFP (n1 = 56 and n2 = 20), COL EzrA–sGFP+PC190723 (n1 = 6 and n2 = 20), ColPBP1TP EzrA–sGFP (n1 = 51 and n2 = 20) and COL EzrA–sGFP+DMPI (n1 = 37 and n2 = 20) (d). n1, number of analysed slopes obtained from EzrA–sGFP movement kymographs. n2, number of analysed slopes obtained from EzrA–sGFP ring constriction kymographs of independent cells. Data were obtained from two independent biological replicates. Statistical analysis was performed using a two-tailed Mann–Whitney U test. n.s., not significant (P ≥ 0.05). ****P < 0.0001. ColPBP1TP EzrA–sGFP versus COL EzrA–sGFP (P = 5.8 × 10⁻¹¹). COL EzrA–sGFP+DMPI versus ColPBP1TP EzrA–sGFP (P = 1.5 × 10⁻¹¹).

