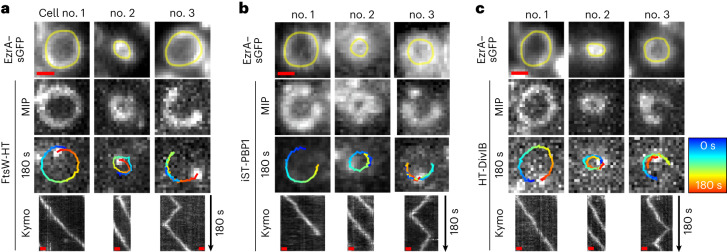
Fig. 2. FtsW, PBP1 and DivIB move directionally around the division site.
a–c, Representative epifluorescence micrographs of cells of JE2 EzrA–sGFP producing FtsW-HT (a), iST-PBP1 (b) or HT-DivIB (c), and grown in TSB rich medium at 37 °C. Cells were sparsely labelled with the fluorescent ligands JF549-HTL or JFX650-STL to visualize single molecules of FtsW-HT and HT-DivIB or iST-PBP1, respectively. Each panel shows three independent cells, of which no. 1 and no. 2 are at an early and a late stage of septum constriction, respectively, and no. 3 exhibits a labelled molecule transitioning between clockwise and counter-clockwise movement around the division site. Single-molecule images acquired in the last frame of a 180-s time series are overlayed with tracks, where blue (0 s) to red (180 s) indicates trajectory time. Space–time kymographs were generated by extracting fluorescence intensity values from FtsW-HT, iST-PBP1 and HT-DivIB images along yellow freehand lines drawn on corresponding EzrA–sGFP rings acquired with the last frame of each time series. MIP, maximum intensity projection, of all 61 time frames. Scale bars, 0.5 µm.

