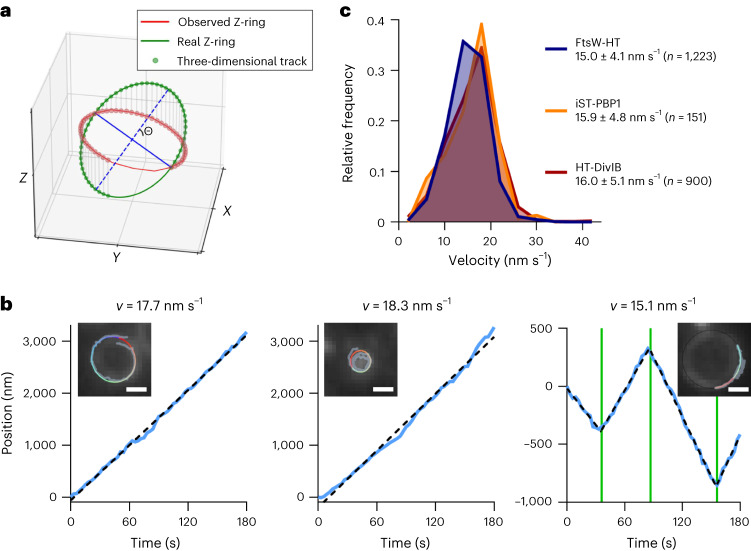
Fig. 3. FtsW, PBP1 and DivIB move directionally with the same velocity.
a, Representation of a simulated single-molecule track of FtsW-HT aligned to an ellipse that was drawn on top of an observed EzrA–sGFP ring. Θ indicates the angle between the imaging and division planes (Supplementary Video 6). b, Examples of unwrapped FtsW-HT trajectories (blue lines in graphs). Left and middle graphs show FtsW-HT in cells at an early and a late stage of septum constriction, respectively, and the right graph shows FtsW-HT transitioning between different directions. Green vertical lines indicate detected breakpoints used to segment tracks to perform a linear regression in each section (indicated by black dashed lines). Average velocity (v) was calculated as the mean of velocities determined for each section. Insets show corresponding micrographs of EzrA–sGFP overlayed with the original track (grey) and the same track after alignment with an ellipse (blue to red indicates trajectory time). Scale bars, 0.5 µm. c, Histograms of FtsW-HT, iST-PBP1 and HT-DivIB single-molecule velocities determined in JE2 EzrA–sGFP background in TSB rich medium at 37 °C. Average velocity is shown as mean with standard deviation. Bin width, 4. Centre of first/last bin, 2/42. Histograms were obtained from at least six biological replicates.

