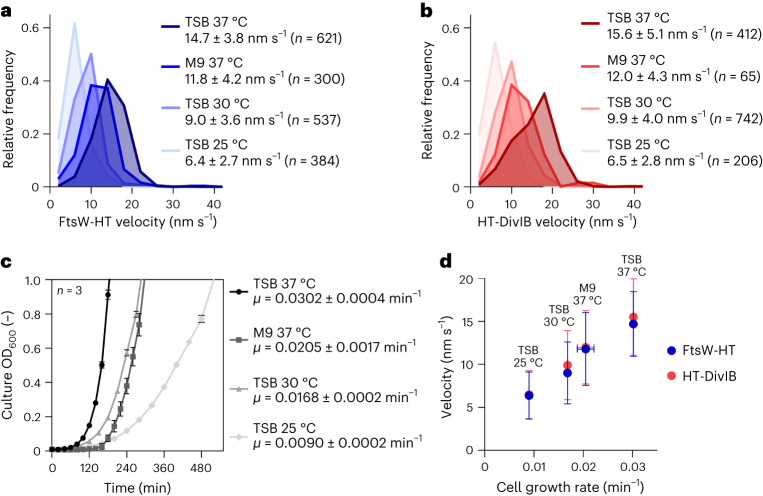
Fig. 4. FtsW and DivIB velocity correlates with cell growth rate.
a,b, Histograms of FtsW-HT (a) and HT-DivIB (b) single-molecule velocities determined in JE2 EzrA–sGFP background, in rich and poor media and at various growth temperatures. Average velocity is shown as mean with standard deviation. Bin width, 4. Centre of first/last bin, 2/42. c, Mean optical density of culture as a function of time, determined for strain JE2 EzrA–sGFP grown in indicated media and at various temperatures. Error bars represent the standard deviations of three biological replicates. d, FtsW-HT and HT-DivIB mean velocities shown in a and b as a function of cell growth rate determined from growth curves shown in c. Horizontal error bars represent the standard deviations from three biological replicates and vertical error bars represent the standard deviations of a minimum of 65 trajectories from three biological replicates.

