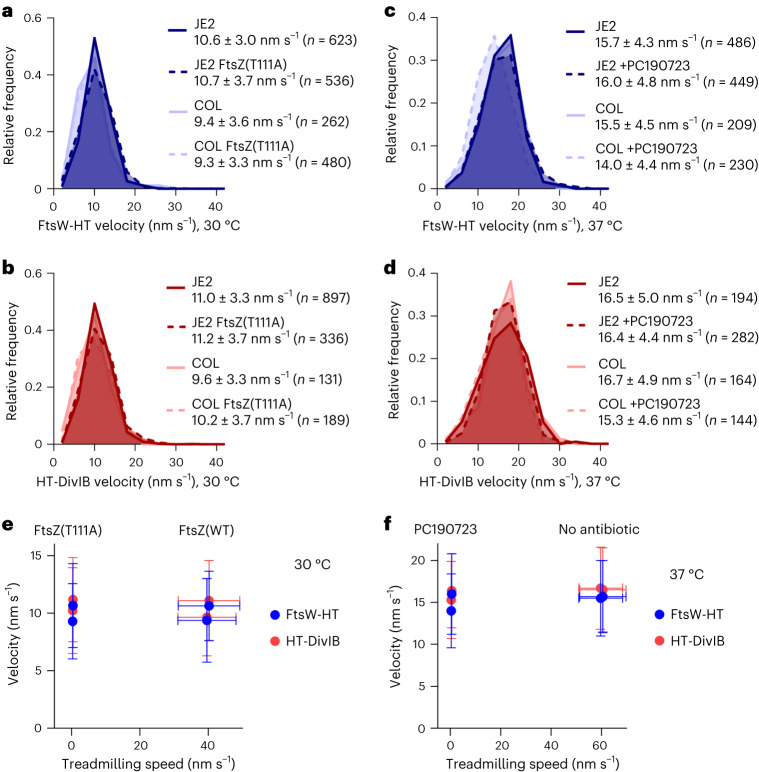
Fig. 5. FtsW and DivIB velocity does not correlate with FtsZ treadmilling speed.
a–d, Histograms of FtsW-HT (a and c) and HT-DivIB (b and d) single-molecule velocities determined in JE2 EzrA–sGFP and COL EzrA–sGFP backgrounds, each producing either FtsZ wild type or temperature-sensitive FtsZ GTPase mutant T111A, from its native genomic locus, in TSB rich medium at 30 °C (a and b), or in the absence and presence of FtsZ inhibitor PC190723 in TSB rich medium at 37 °C (c and d). Average velocity is shown as mean with standard deviation. Bin width, 4. Centre of first/last bin, 2/42. e,f, FtsW-HT and HT-DivIB mean velocities shown in a,b (e) and c,d (f) as a function of FtsZ treadmilling speed shown in Fig. 1 and Supplementary Table 1. Horizontal error bars represent the standard deviations of a minimum of 6 and a maximum of 171 slopes and vertical error bars represent the standard deviations of a minimum of 131 trajectories from three biological replicates.

