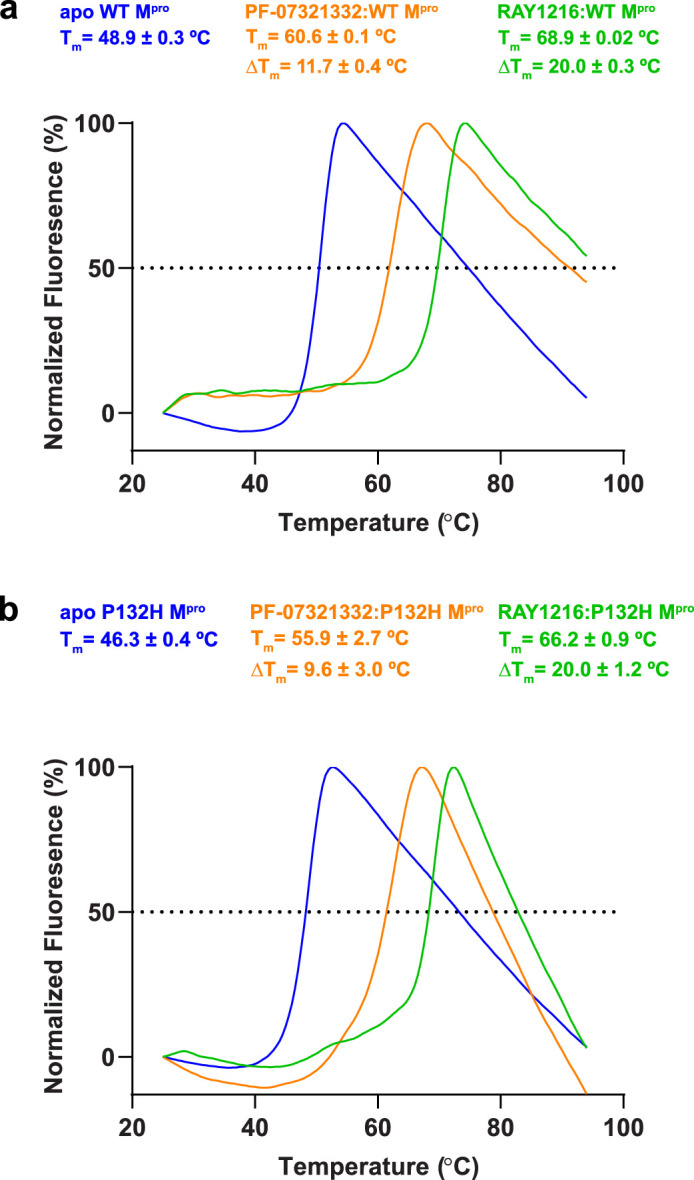
Extended Data Fig. 1. Thermal melting curves of WT and P132H Mpro proteins and their inhibitor complexes.

Experiments were carried out at an Mpro concentration of 3 μM. For the inhibitor complexes, 30 min incubation at 16 °C with 6 μM RAY1216 (green) or PF-07321332 (orange) was performed before the melting curves were recorded. a, WT Mpro proteins and their complexes. b, P132H Mpro proteins and their inhibitor complexes. Tm values and thermal shift ΔTm values are shown as mean ± SD (n = 3).
