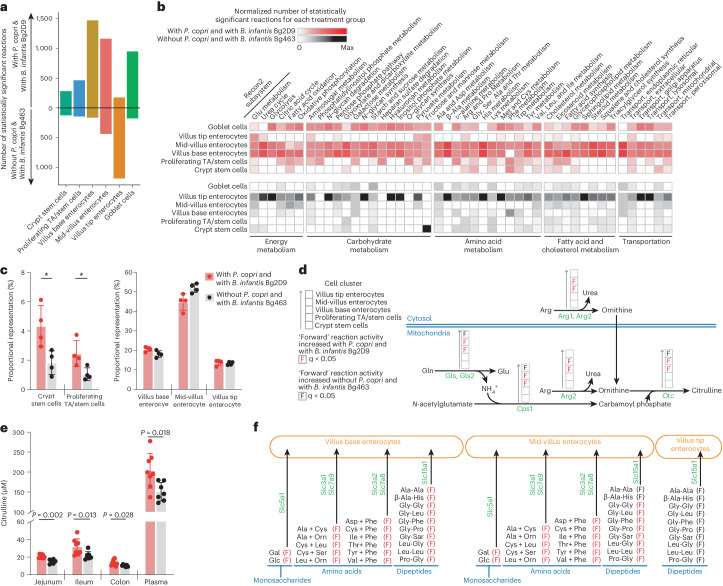
Fig. 2. snRNA-seq analysis and targeted mass spectrometric analysis of intestinal tissue and plasma collected from mice containing bacterial communities with or without P. copri and two different strains of B. infantis.
Jejunal tissue samples collected from arm 1 (with P. copri and with B. infantis Bg2D9) and arm 3 (without P. copri and with B. infantis Bg463) at the end of the experiment (P53) described in Fig. 1a were analysed (n = 4 samples/treatment arm for a–d and f). a, The number of Recon2 reactions with statistically significant differences in their predicted flux between mice in Arm 1 and Arm 3. TA, transit amplifying. b, The number of Recon2 reactions in each Recon2 subsystem that are predicted to have statistically significant differences in their activities between the two treatment groups. Colours denote values normalized to the sum of all statistically significantly different Recon2 reactions found in all selected cell clusters for a given Recon2 subsystem in each treatment group. c, Proportional representation of cell clusters identified by snRNA-seq. Asterisks denote ‘statistically credible differences’ as defined by scCODA (Supplementary Table 10c and Methods). Mean values ± s.d. are shown. d, Selected Recon2 reactions in enterocyte clusters distributed along the villus involved in the urea cycle and glutamine metabolism. e, Targeted mass spectrometric quantifications of citrulline levels along the length of the gut and in plasma. Mean values ± s.d. and P values from the two-sided Mann–Whitney U test are shown. Each dot represents an individual animal (n = 8 and 7 for arms 1 and 3, respectively). f, Effect of colonization with bacterial consortia containing or lacking P. copri on extracellular transporters for monosaccharides, amino acids and dipeptides. Ala, alanine; Arg, arginine; Asp, aspartate; Cys, cysteine; Gal, galactose; Glc, glucose; Gln, glutamine; Glu, glutamate; Gly, glycine; His, histidine; Ile, isoleucine; Leu, leucine; Lys, lysine; Met, methionine; Orn, ornithine; Phe, phenylalanine; Pro, proline; Sar, sarcosine; Ser, serine; Thr, threonine; Trp, tryptophan; Tyr, tyrosine; Val, valine. These transporters were selected, and the spatial information of their expressed region along the length of the villus was assigned based on published experimental evidence29. Arrows in d and f indicate the ‘forward’ direction of each Recon2 reaction. The Wilcoxon rank-sum test was used to evaluate the statistical significance of the net reaction scores (a, b, d and e) between the two treatment groups. P values were calculated from Wilcoxon rank-sum tests and adjusted for multiple comparisons (Benjamini–Hochberg method); q < 0.05 was used as the cut-off for statistical significance.

