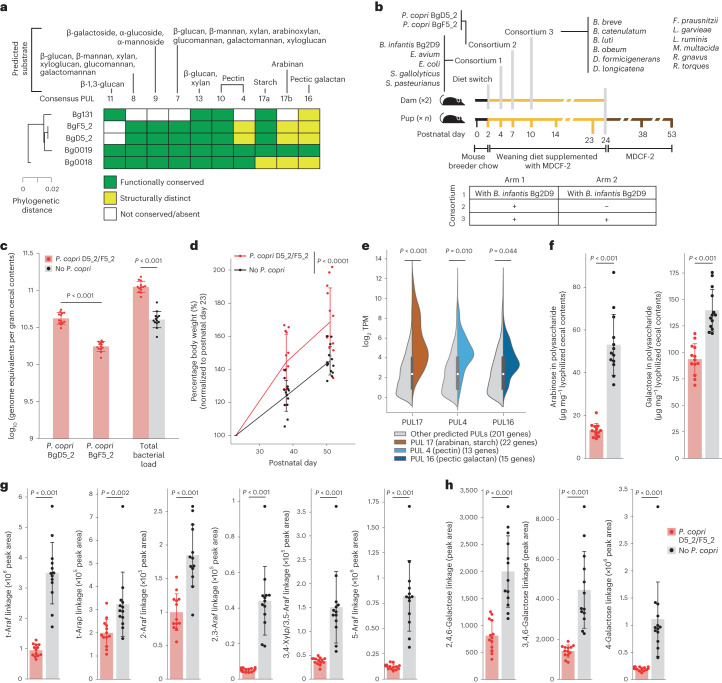
Fig. 3. Testing the effects of pre-weaning colonization with two P. copri strains closely related to MAGs Bg0018 and Bg0019 on host weight gain and MDCF-2 glycan degradation.
a, Comparison of PULs highly conserved in the two P. copri MAGs with their representation in the three cultured P. copri strains. b, Study design (n = 2 dams and 13 offspring per treatment arm). c, Absolute abundance of P. copri strains and total bacterial load in caecal contents collected at the end of the experiment (P53). Exact P values for comparisons of BgD5_2 and BgF5_2 and total bacterial load are 2 × 10⁻⁵ and 2 × 10⁻⁵, respectively. d, Body weights of the offspring of dams, normalized to P23. The P value for the group difference is P = 4 × 10⁻⁵ (linear mixed effects model (Methods)). e, GSEA of expression of PULs shared by P. copri BgD5_2 and BgF5_2 in the caecal contents of animals. Benjamini–Hochberg adjusted P values were calculated using GSEA ranking genes by their mean log2 TPM across the P. copri colonized samples, with each PUL comprising a gene set against the background of all predicted PUL genes. Violin plots show the log2 TPM of all genes assigned to any of the 22 predicted PULs in each isolate (n = 201 genes) in each of the samples, split to show homologues of consensus PUL 17 (arabinan, starch; n = 22 genes), PUL 4 (pectin; n = 13 genes) and PUL 16 (pectic galactan; n = 15 genes) in colour compared to the remainder of all PUL genes in grey. Internal box plots show the median (circle) and quartiles (box boundaries) for all genes assigned to PULs. P = 1 × 10⁻⁴ for PUL 17. f, UHPLC-QqQ-MS analysis of total arabinose and galactose in glycans present in caecal contents collected at P53. The P value for both arabinose and galactose is 2 × 10⁻⁵. g,h, UHPLC-QqQ-MS of glycosidic linkages containing arabinose (g) and galactose (h) in caecal contents. The exact P values for t-Araf, 2-Araf, 2,3-Araf, 3,4-Xylp/3,5-Araf and 5-Araf (g) are 2 × 10⁻⁵, 8 × 10⁻⁵, 2 × 10⁻⁵, 2 × 10⁻⁵ and 2 × 10⁻⁵, respectively. The exact P values for 2,4,6-galactose, 3,4,6-galactose and 4-galactose are 3 × 10⁻⁵, 2 × 10⁻⁵ and 2 × 10⁻⁵, respectively. Mean values ± s.d. are shown. P values were calculated using a two-sided Mann–Whitney U test (c,f–h). Each dot in b–h represents an individual animal.

