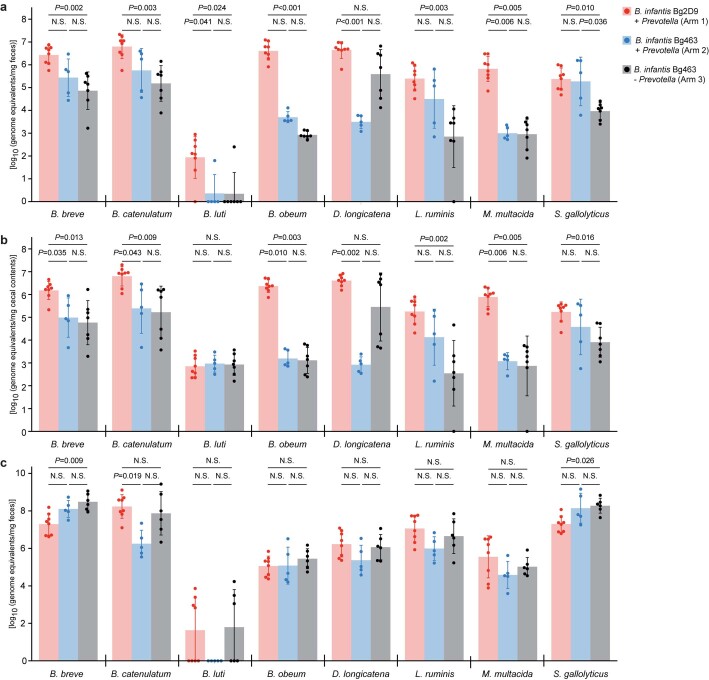
Extended Data Fig. 2. Absolute abundances of other bacterial species in the defined community across different time points and locations.
(a) Absolute abundances of organisms which were significantly higher with either B. infantis Bg2D9 (Arm 1 vs. Arm 2), or with the combination of B. infantis Bg2D9 and Prevotella (Arm 1 vs. Arm 3) in fecal samples collected at P53 (n = 8, 5, and 7 offspring for arms 1, 2, and 3, respectively). The adjusted P-values for B. obeum (Arm 1 vs. Arm 3) and D. longicatena (Arm 1 vs. Arm 2) are 2x10⁻⁴ and 7x10⁻⁴, respectively. (b, c) Absolute abundances of the same organisms in cecal contents collected at P53 (panel b) and in fecal samples collected before weaning at P21 (panel c). Mean values ± SD are shown. Each dot represents an individual animal. P-values were calculated by the Kruskal-Wallis test followed by post-hoc Dunn’s test with Bonferroni correction. N.S., not significant (P > 0.05).

