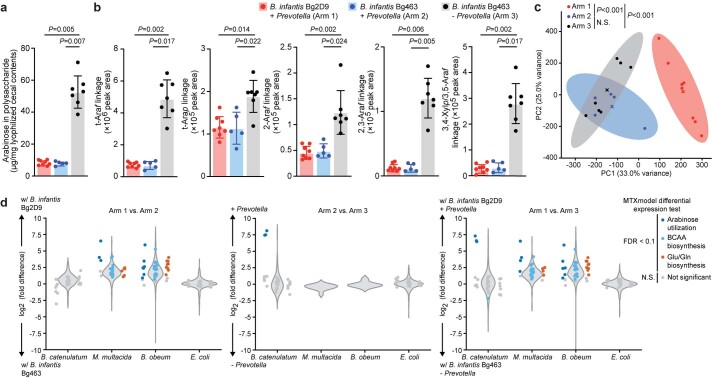
Extended Data Fig. 3. Targeted mass spectrometric and microbial RNA-Seq analyses of consortia of cultured age-discriminatory and WLZ-associated bacteria strains that colonized gnotobiotic mice.
Cecal contents collected at the end of the experiment described in Fig. 1a were analyzed. (a,b) UHPLC-QqQ-MS-based quantitation of levels of total arabinose (panel a) and arabinose-containing glycosidic linkages (panel b) in cecal glycans collected at P53. Abbreviations: Araf, arabinofuranose; Arap, arabinopyranose; Xylp, xylopyranose. Each dot represents an individual animal (n = 8, 5, and 7 offspring for arms 1, 2, and 3, respectively). Mean values ± s.d. are shown. P values were calculated by the Kruskal-Wallis test followed by post-hoc Dunn’s test with Bonferroni correction for panels a and b. (c) PCA of profiles of normalized meta-transcriptomic counts (see Methods). Centroids are denoted by a colored ‘X’ for each group. P-values were calculated by PERMANOVA. (d) MTXmodel abundance-normalized differential expression analysis of genes involved in specific carbohydrate utilization and amino acid biosynthetic pathways in the four arabinose-utilizing bacteria. Violin plots show the distribution of log2 fold-differences for all expressed genes with metabolic pathway annotations in the indicated organism. Dots in panel d represent differential expression test results for individual genes involved in the corresponding pathway and are coloured if their Benjamini-Hochberg adjusted P-value is less than 0.1 (see Methods). Abbreviations: BCAA, branched-chain amino acid; Glu, glutamate; Gln, glutamine.

