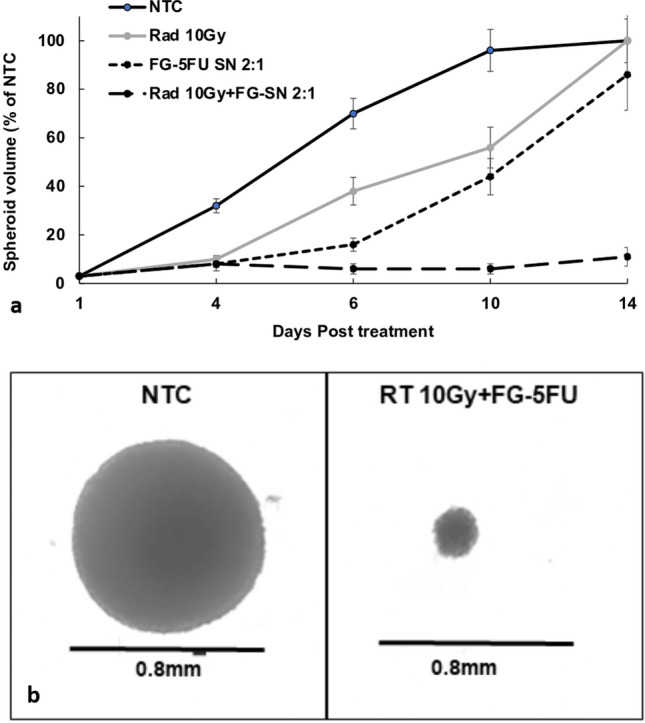
Fig. 4.

a Growth kinetics of spheroid growth following treatment: RT only (10 Gy), FG-5FU only (2:1 dilution), and FG-5FU + RT (2:1 dilution, 10 Gy). Spheroid volume assayed after 4, 6, 10, and 14 days. Each data point represents the average volume of 16 spheroids, from 2 experiments, after 14 days in culture as a % of non-treated controls. Error bars, standard deviation. * Significant differences (p < 0.05) compared to controls. b Light micrograph of non-treated control (NTC) and FG-5FU + RT (10 Gy) treated spheroids
