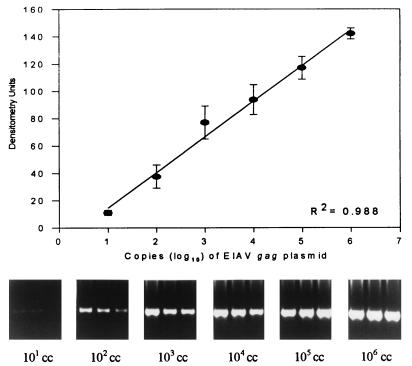
FIG. 4.
Example of a standard curve used to quantitate EIAV gag DNA in tissues by PCR. Plasmid copy number is plotted against densitometry units. R2, regression coefficient. Portions of agarose gel, stained with ethidium bromide, show PCR bands in triplicate from serial dilutions of EIAV gag-containing plasmid. cc, copies of plasmid.

