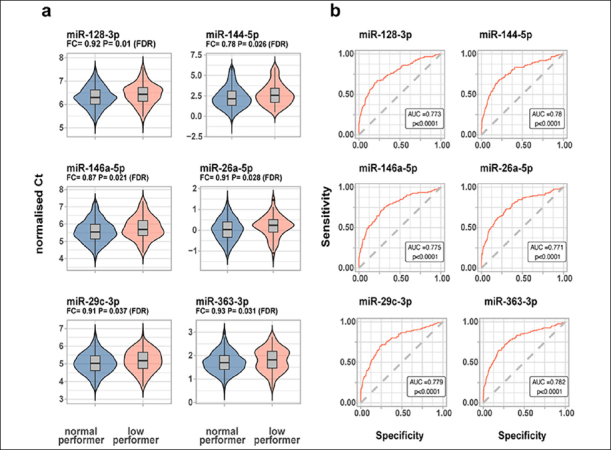
Figure 1.

MiRNA expression levels in healthy individuals in CHARIOT PRO (n=830)
a) miRNAs significantly dysregulated between the normal vs low performance group, with higher Ct values corresponding to lower expression b) ROC curves for significant miRNAs. Legend: In figure B, the ROC p value reflects the significance level of the deviation from the null hypothesis (i.e. AUC = 0.50)
