
Figure 1.
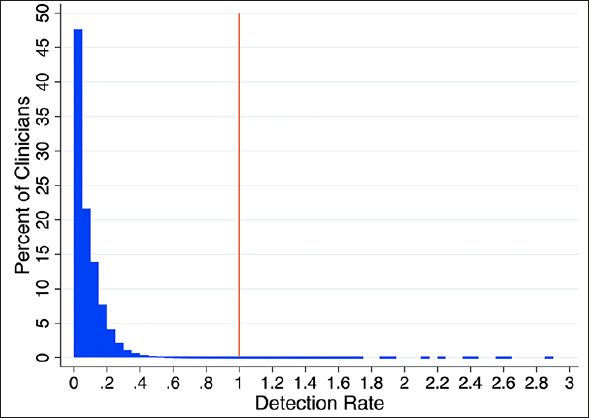
Distribution of the detection rates (the ratio of observed over expected rates) for clinicians on mild cognitive impairment, with reference to ratio of 1 as the ideal detection rate (red vertical line)
Official websites use .gov
A
.gov website belongs to an official
government organization in the United States.
Secure .gov websites use HTTPS
A lock (
) or https:// means you've safely
connected to the .gov website. Share sensitive
information only on official, secure websites.
Distribution of the detection rates (the ratio of observed over expected rates) for clinicians on mild cognitive impairment, with reference to ratio of 1 as the ideal detection rate (red vertical line)