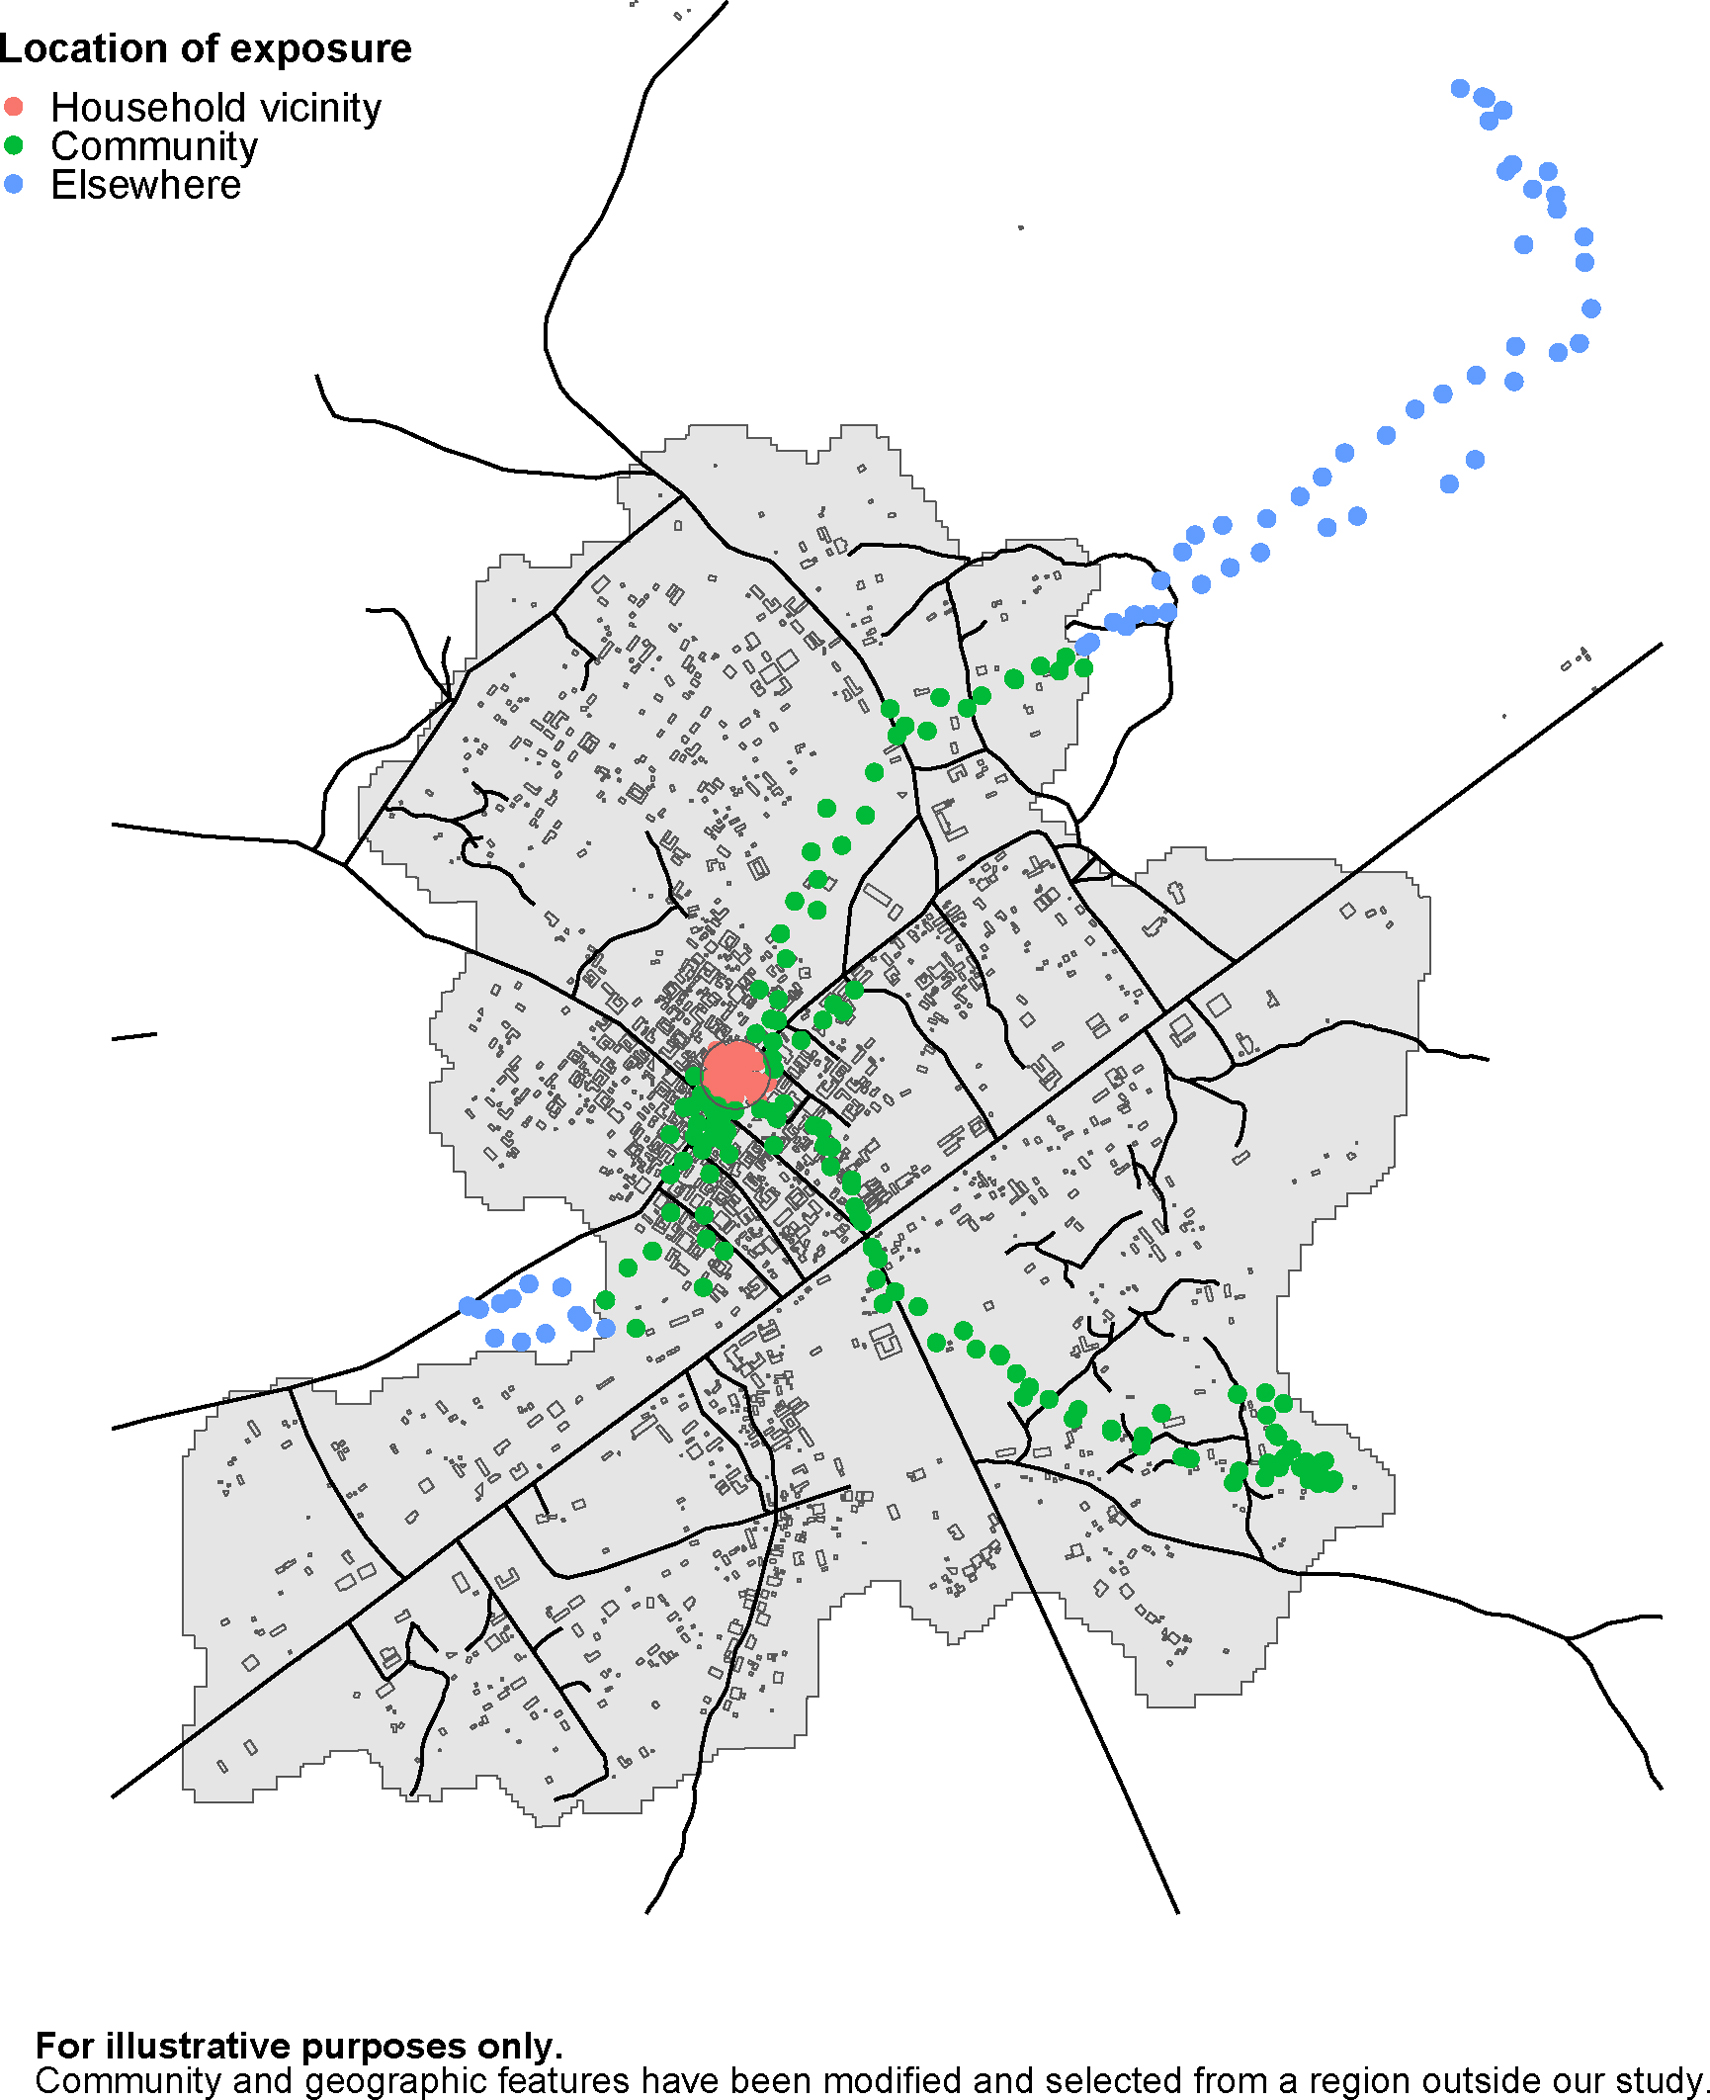
Figure 1.

Example of a GPS trajectory throughout a session. GPS points are color-coded as being within the vicinity of the household (50m buffer), community boundaries or elsewhere. Outlines of arbitrary shapes represent buildings in the area and lines represent roadways.
