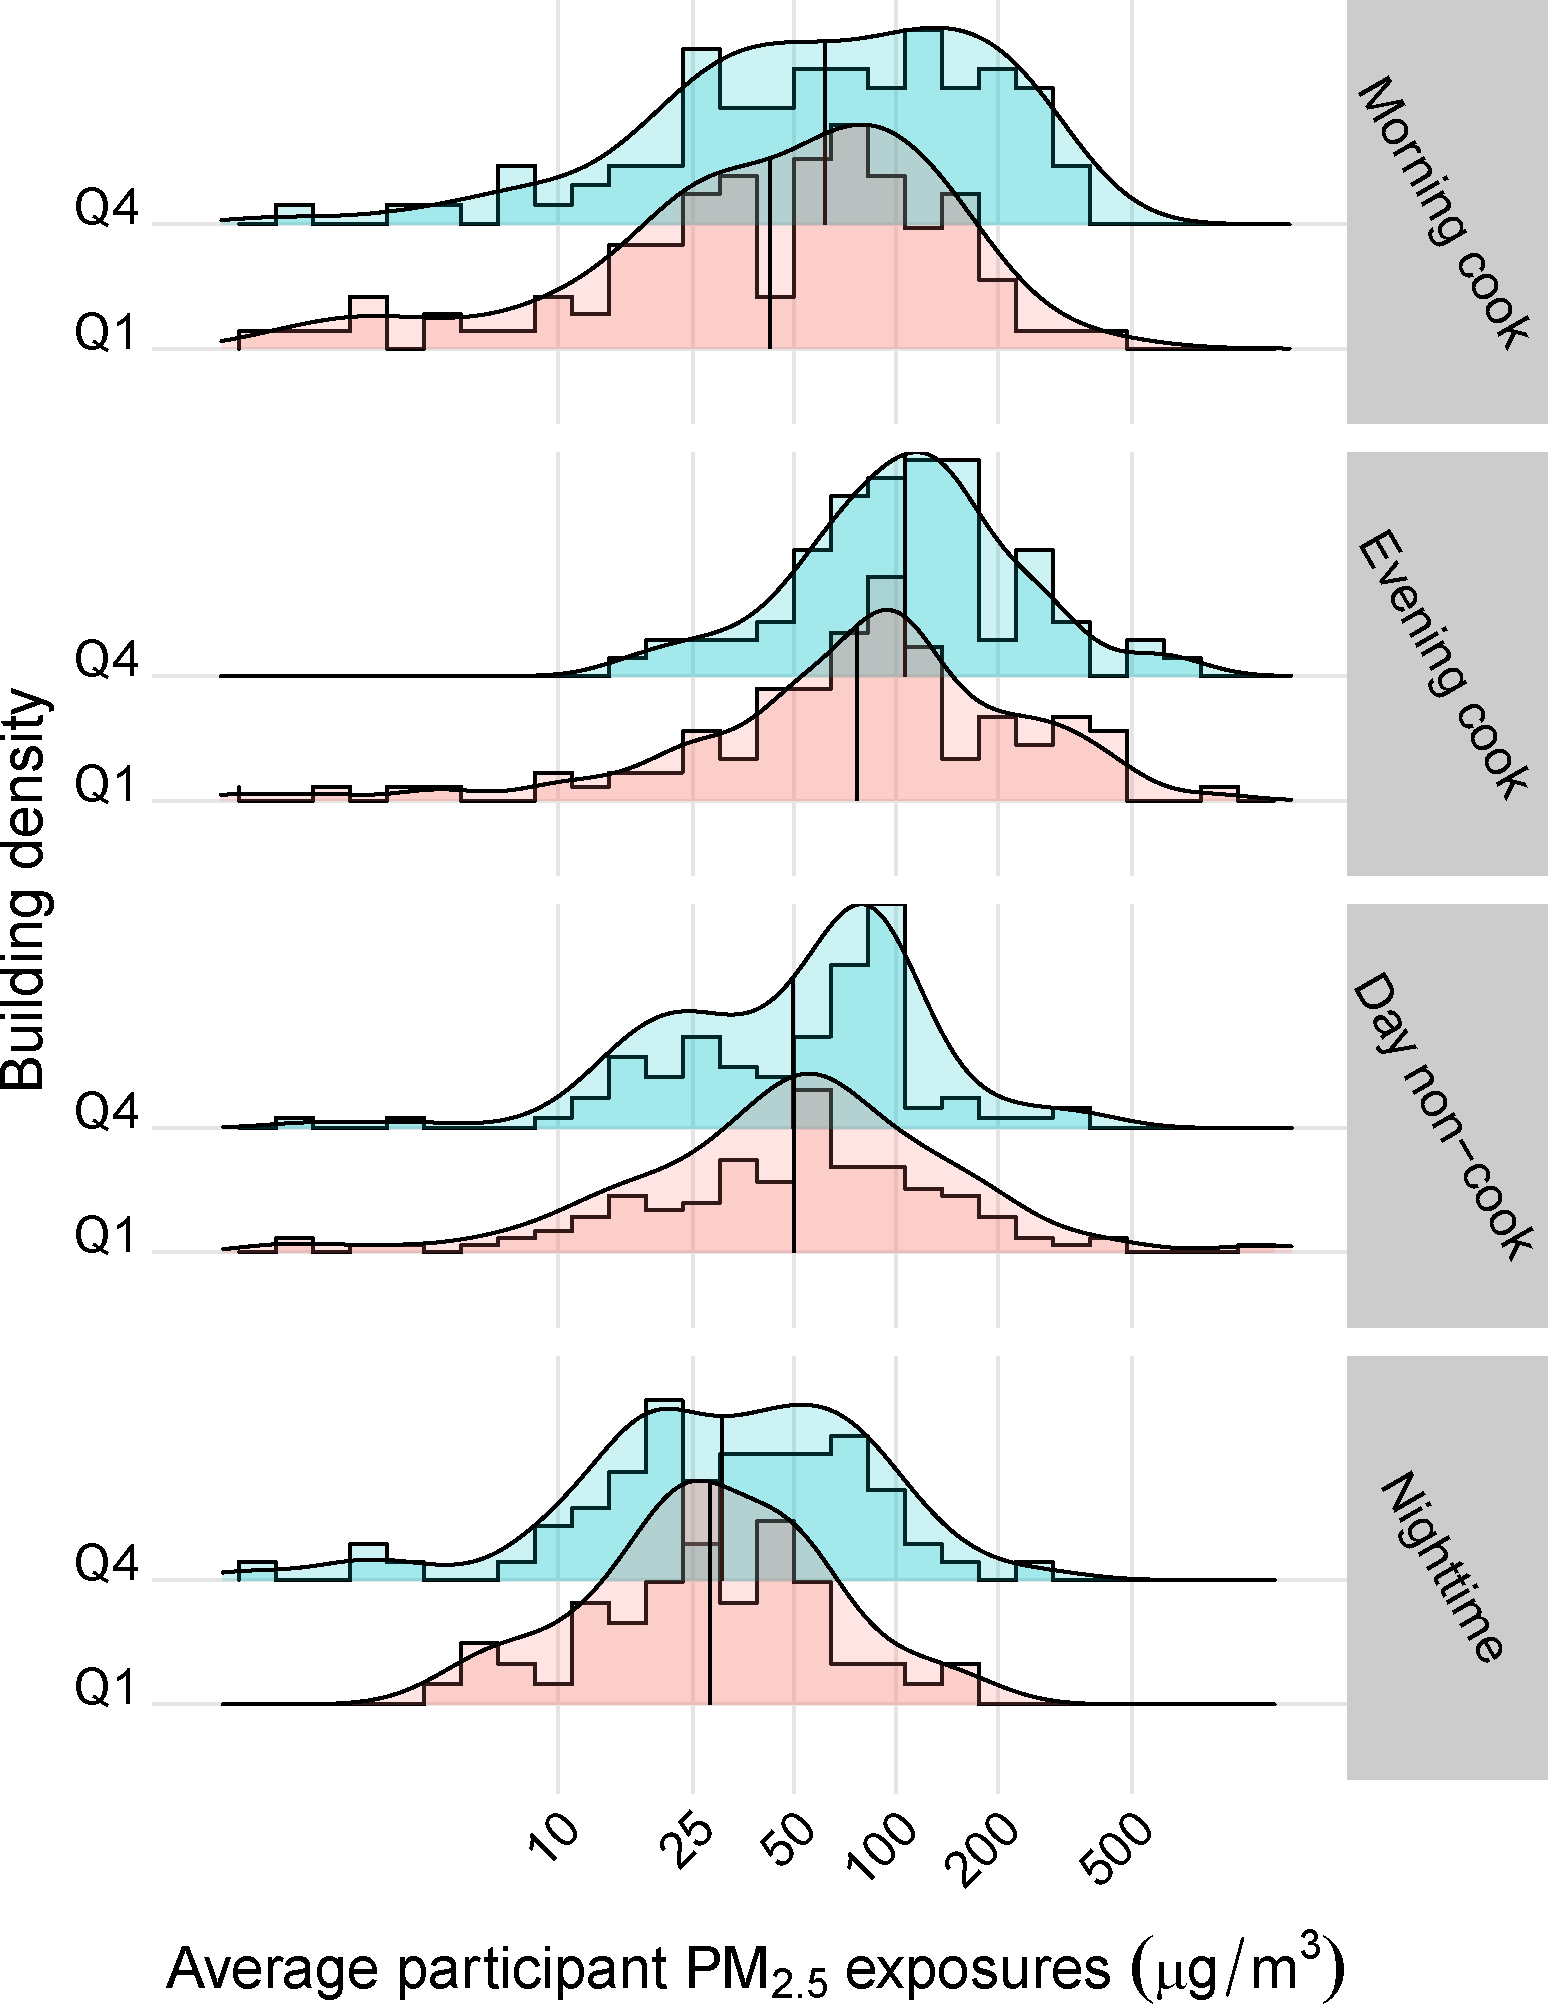
Figure 2.

Distribution of average participant PM2.5 exposures (μg/m3) for the fourth versus first quartile (Q4 vs. Q1) of surrounding building density (80%+ confidence) by time of day. The intersecting black vertical line in each histogram represents the mean value.
