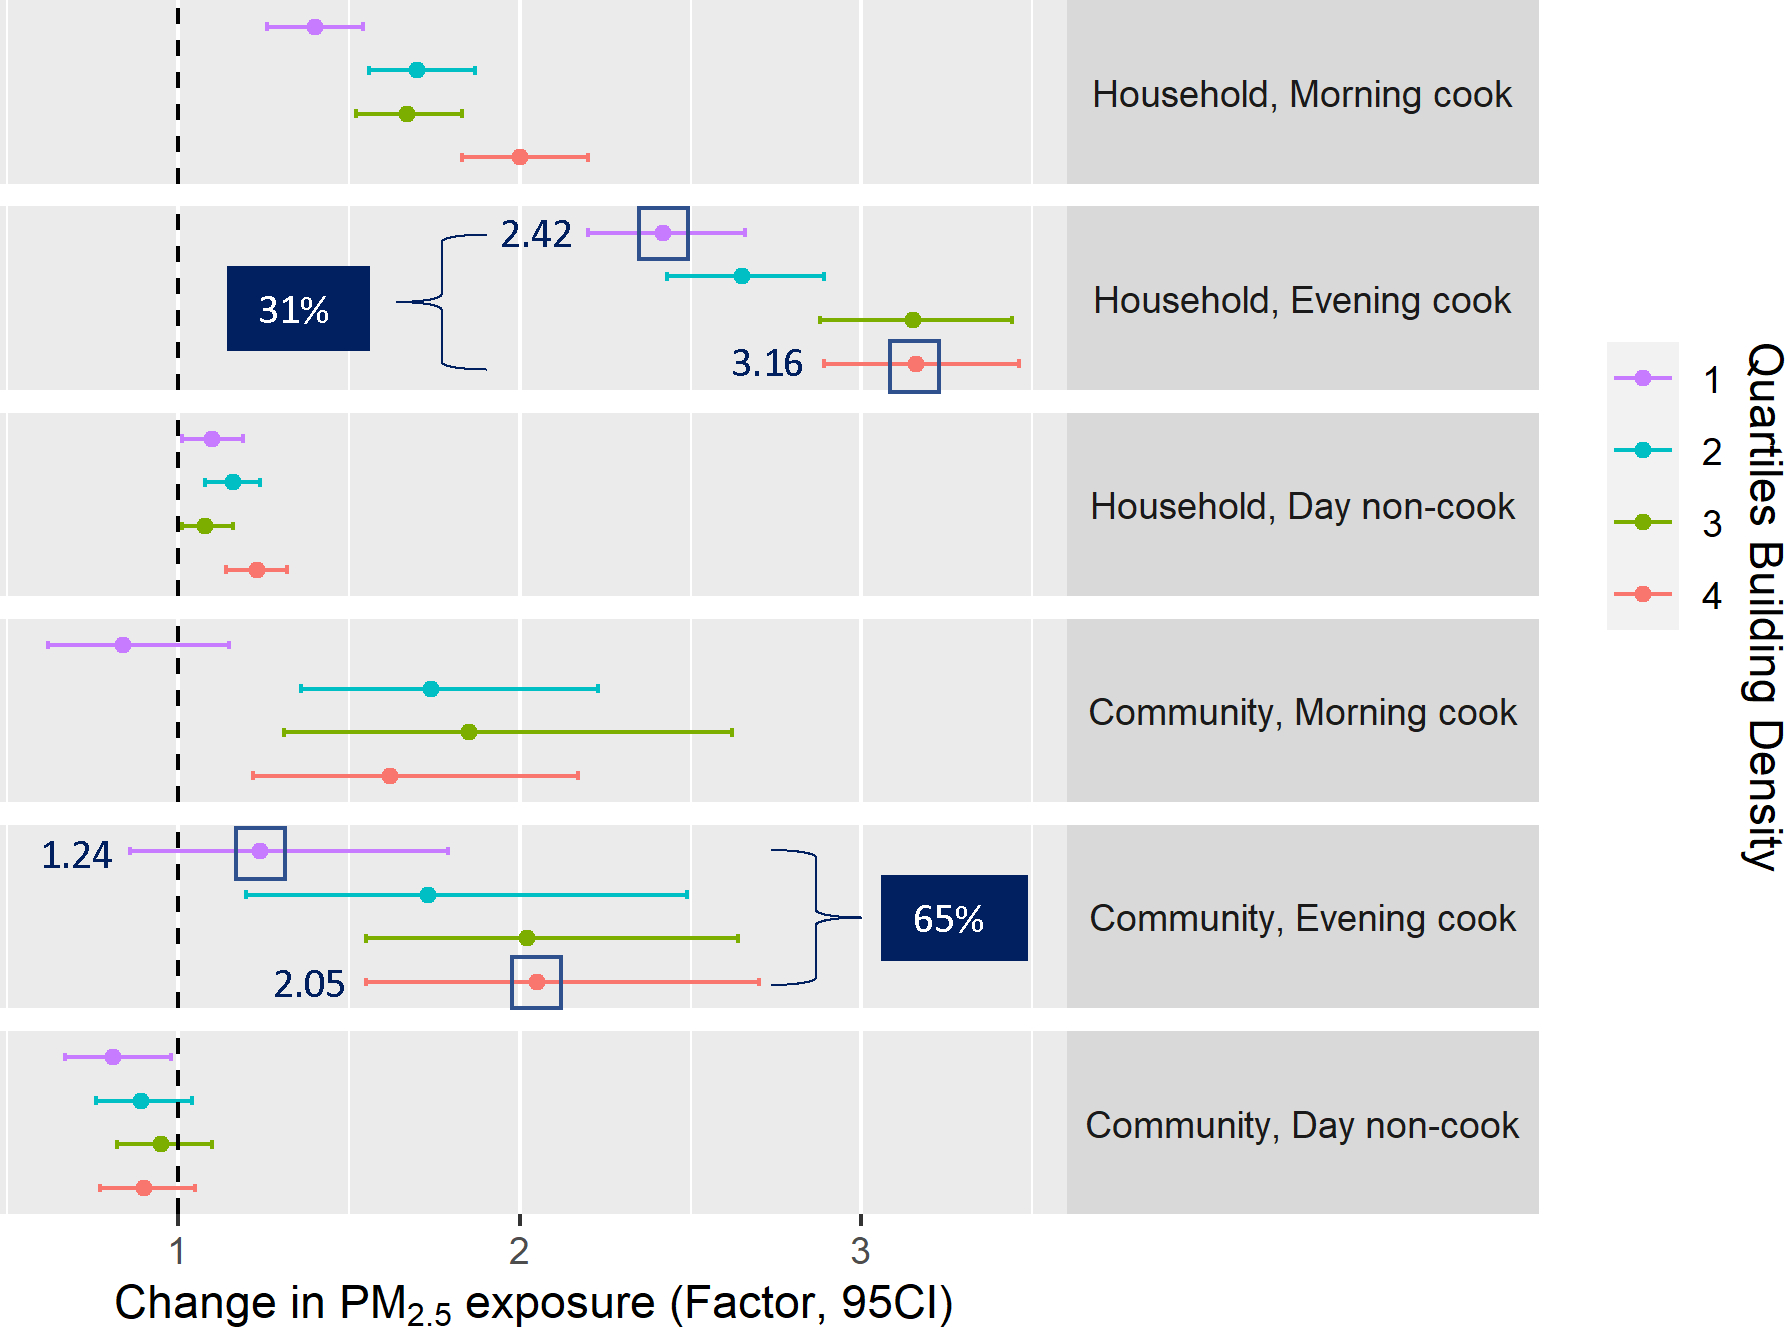
Figure 3.

Factor change in 30-minute average log-transformed PM2.5 exposure (μg/m3) and 95% confidence intervals for location-time environments modeled jointly with quartiles of surrounding building density. Reference is exposures during nighttime in the household. Model adjusted for nested random effects community and participant ID and fixed effects Harmattan season, participant type (child or mother) and wearing compliance. Dark blue box shows the relative percentage increase from Q1 to Q4.
