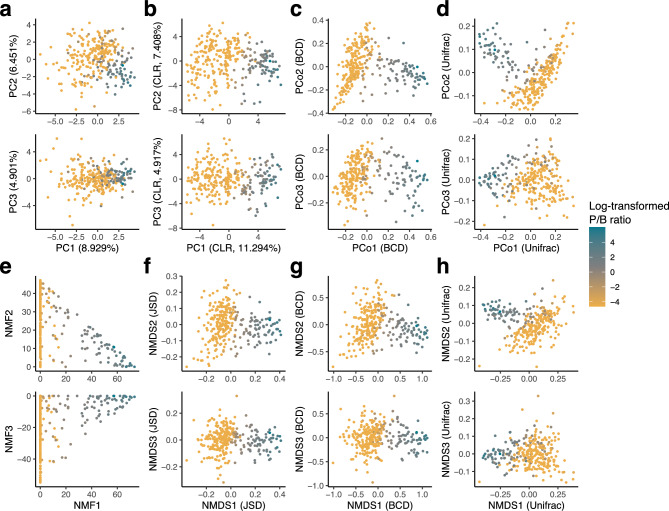
Figure 2.
Distribution of the gut microbial community using different dimension reduction methods. (a) principal component analysis (PCA), (b) PCA on the centered log-ratio (CLR) transformed abundance matrix, (c, d) principal coordinate analysis with the Bray–Curtis dissimilarity (BCD) and the UniFrac distance, (e) non-negative matrix factorization, (f–h) non-metric multidimensional scaling with the Jensen-Shannon distance, BCD, and UniFrac distance. The top panel shows the top 1 (x-axis) and 2 (y-axis) composite variables, while the bottom panel shows the top 1 (x-axis) and 3 (y-axis) composite variables. The colour of the point indicates the log-transformed P/B ratio.

