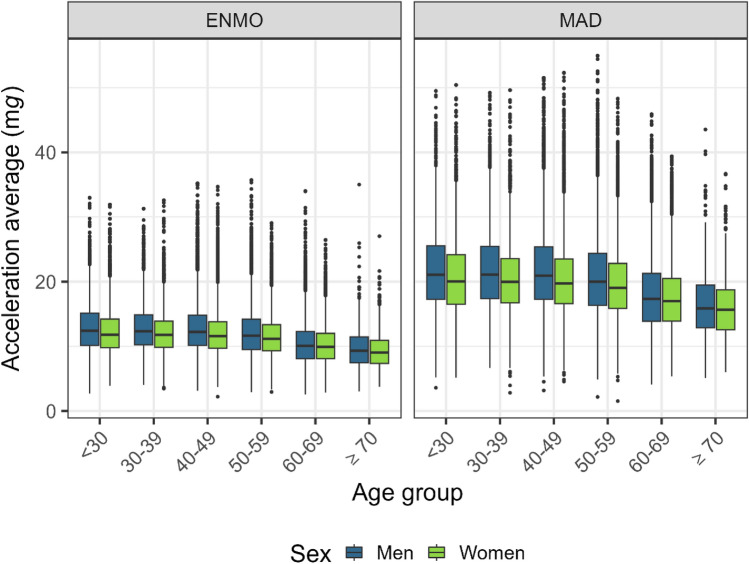
Figure 2.
Magnitude of acceleration (ENMO and MAD) by age and sex. ENMO Euclidean Norm Minus One with negative values set to zero, MAD mean amplitude deviation, see text, mg milli gravitational acceleration. n = 63,236. ENMO and MAD values were winsorized at age- and sex-specific 99.9th percentile. Interpretation of box and whiskers plot: The box depicts the interquartile range (IQR, central 50% of the distribution) with the 25% quantile and the 75% quantile as lower and upper limits, respectively, as well as the median (50% quantile, middle line); the lower whisker shows the smallest observation that is greater than or equal to the 25% quantile − 1.5 × IQR; the upper whisker depicts the largest observation that is less than or equal to the 75% quantile + 1.5 × IQR; the dots indicate outliers beyond the whiskers.

