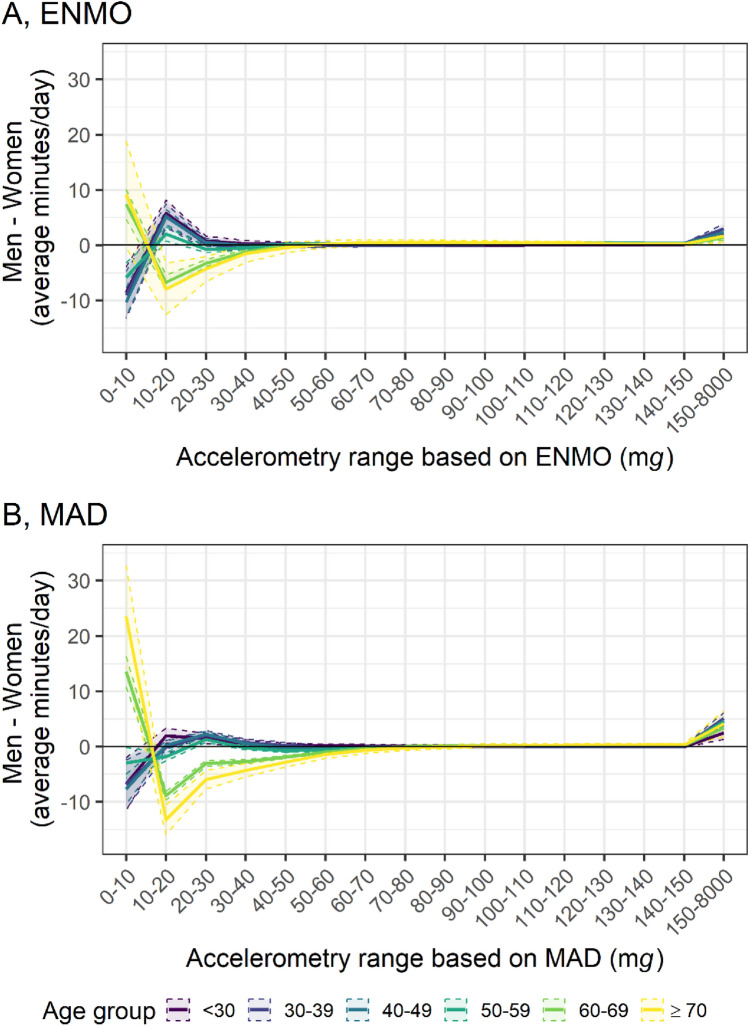
Figure 6.
Sex-differences of time spent in acceleration ranges based on (A) ENMO and (B) MAD by age. ENMO Euclidean Norm Minus One with negative values set to zero, MAD mean amplitude deviation, mg milli gravitational acceleration. n = 63,236. Lines represent the difference of the mean time (minutes per day) spent in acceleration categories in the group of men and the group of women. Shading bounds represent the 95% confidence interval of the two-sample t-test with the Null hypothesis: “true difference in means between group men and group women is equal to zero”. Values were not winsorized.

