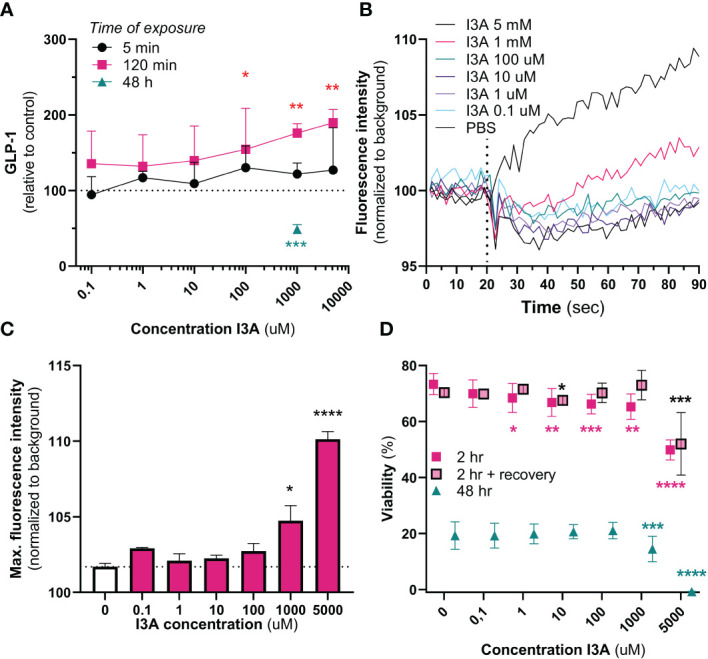
Figure 2.

In vitro effects of I3A. Effects of I3A on different parameters in GLUTag cells. In all experiments, I3A was added to a buffer containing 5.6 mM glucose. (A): GLP-1 secretion measured in response to different I3A-concentrations for an exposure time of 5 min (black circle, n=3), 120 min (red square, n=3) or 48 hours (green triangle, n=2). Levels were normalized to buffer containing no I3A. (B): intracellular calcium mobilization, expressed as fluorescence intensity normalized to background over time, for different I3A concentrations. Interventions were given at 20 seconds (n=4). (C): maximum peak of intracellular calcium mobilization, as seen in (B), for each intervention. (D): Viability measured in response to different I3A-concentratons after an exposure time of 2 hr (red square, n=4), 2 hours followed by 24 hours of recovery in culture medium (red square with black border, n=4) and 48 hours (green triangle, n=4). Levels were normalized to the viability in culture medium. Data are presented as mean ± standard error of the mean. Statistical analyses were performed using linear mixed models, comparing intervention to negative control. *p<0.05, **p<0.01, ***p<0.001 and ****p<0.0001.
