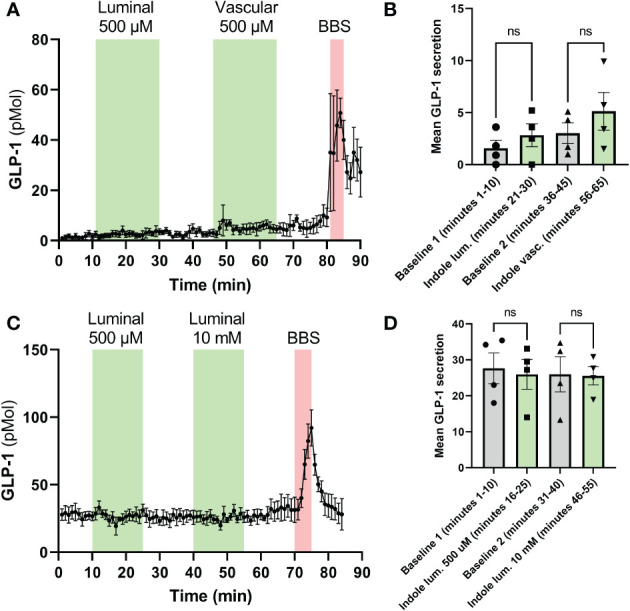
Figure 3.

Effects of I3A on perfusion models. The effects of I3A on GLP-1 secretion were assessed in isolated rat colon perfusion models. Both luminal and vascular application of I3A were studied. In the left (A, C), the hormone levels are shown minute-by-minute over the duration of the experiment. The green areas represent the time during which I3A was perfused, the red areas represent the positive control (BBS, bombesin). In the right (B, D), averages of the last 10 minutes of each baseline and intervention are shown. (A): GLP-1 levels in rat colon perfusions; (B): 10-minute average for experiments in (A). (C): GLP-1 levels in mouse colon perfusions; (D): 10-minute average for experiments in (C). All data are given as mean ± standard error of the mean. Statistics were performed on the averages using paired t-tests. NS, not significant.
