
Figure 3.
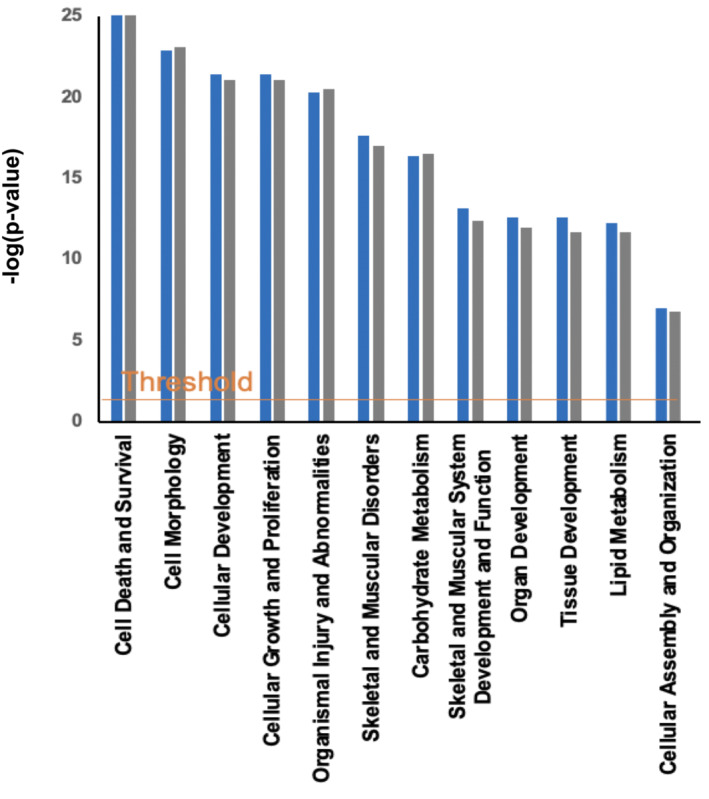
Muscle mRNA changes occurred after bed‐rest and exercise‐supplemented remobilization but did not reflect the physiological and metabolic events observed. Cellular functions identified by IPA as being most altered in muscle as a result of bed‐rest (blue) and exercise‐supplemented remobilization (grey) relative to before bed‐rest, based on mRNA expression data generated using the low‐density micro‐array cards. The x axis displays cellular functions most affected by bed‐rest, and the y axis displays the −log of the P value. The threshold line corresponds to a fold change of 1.5 and a P value of 0.05.