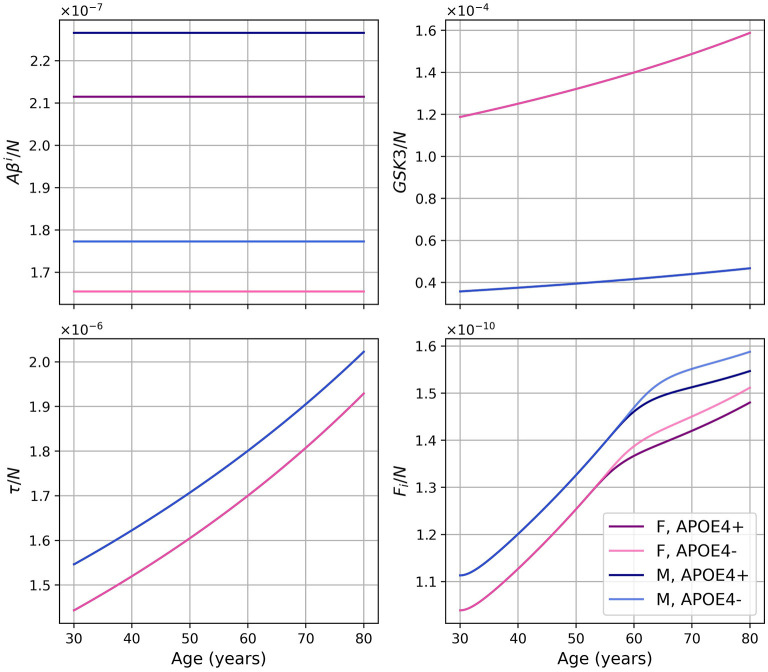
Figure 10.
Concentration of intracellular Aβ (Aβi), GSK-3, phosphorylated/hyperphosphorylated tau proteins (τ), and intracellular NFTs (Fi) normalized by the density of neurons for the model with reduced microglia activation rate (κFoM × 0.5 and ). The curves for GSK3/N and τ/N for the same sex overlap.

