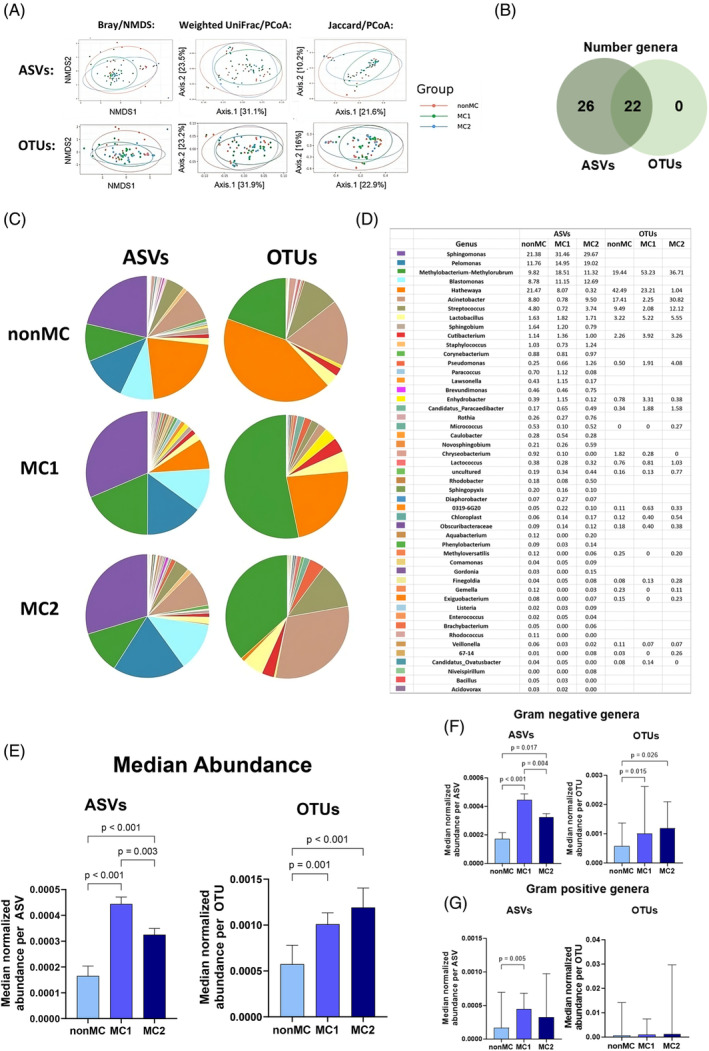
FIGURE 2.

ASV compared to OTU annotation of genera found in at least 4% of all samples. (A) Beta‐diversity calculated with Bray/NMDS, Weighted UniFrac/PCoA and Jaccard/PCoA with either ASV annotation or OTU annotation. (B) The overlap of genera detected with ASVs compared to OTUs. (C) The microbial distribution of ASVs compared to OTU on the genera level with a corresponding (D) table indicating the percentage of each genus based on the median normalized abundance. (E) The median abundance of genera extracted with ASVs or OTUs compared between nonMC, MC1, and MC2. (F) Gram‐negative or (G) gram—positive extracted ASVs and OTUs compared between nonMC, MC1, and MC2. Significance tested with Friedman's test and corrected for multiple comparisons with Dunn's statistical hypothesis testing. ASV, amplicon sequencing variant; OTU, operational taxonomic unit.
