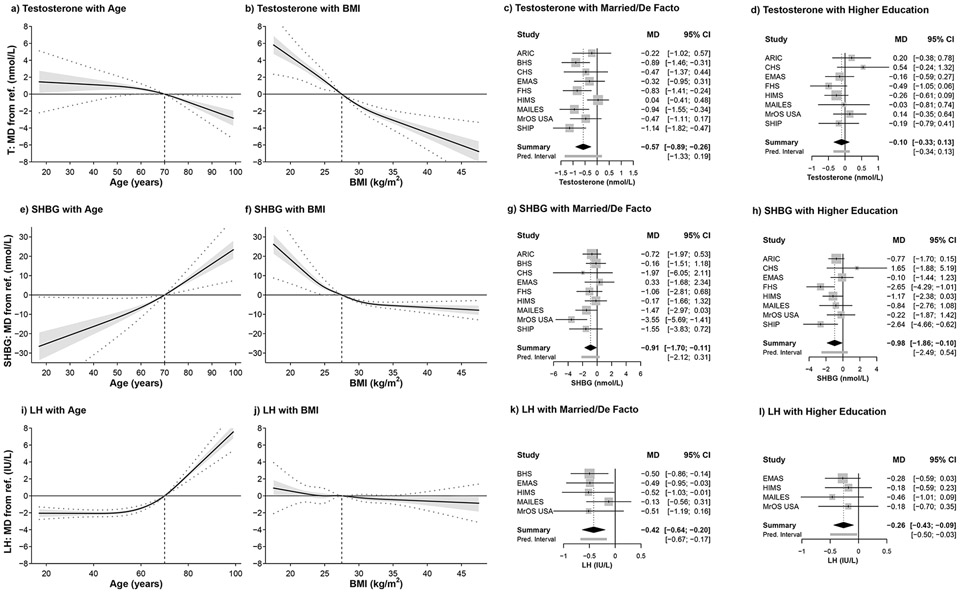
Figure 1.
Summary curves and forest plots for the associations of sociodemographic factors with testosterone, SHBG, and LH concentrations after controlling for all other sociodemographic predictors in Model 1 (refer Appendix Table A1). MD = mean difference; vertical dashed line on summary curves identifies the reference level (ref.) for the predictor of interest; dotted lines show 95% prediction intervals; forest plots show the MD from the reference level of the categorical predictor (refer Supplementary Tables S2, S3). MD=mean difference, CI=confidence interval, T=testosterone, SHBG=sex hormone-binding globulin, LH=luteinising hormone, BMI=body mass index, Pred. interval=prediction interval. ARIC=Atherosclerosis Risk in Communities Study, BHS=Busselton Health Study, CHS=Cardiovascular Health Study, EMAS=European Male Ageing Study, FHS=Framingham Heart Study, HIMS=Health In Men Study, MAILES=Men Androgen Inflammation Lifestyle Environment and Stress study, MrOS USA=Osteoporotic Fractures in Men USA study, SHIP=Study of Health in Pomerania SHIP.

