
FIGURE 4.
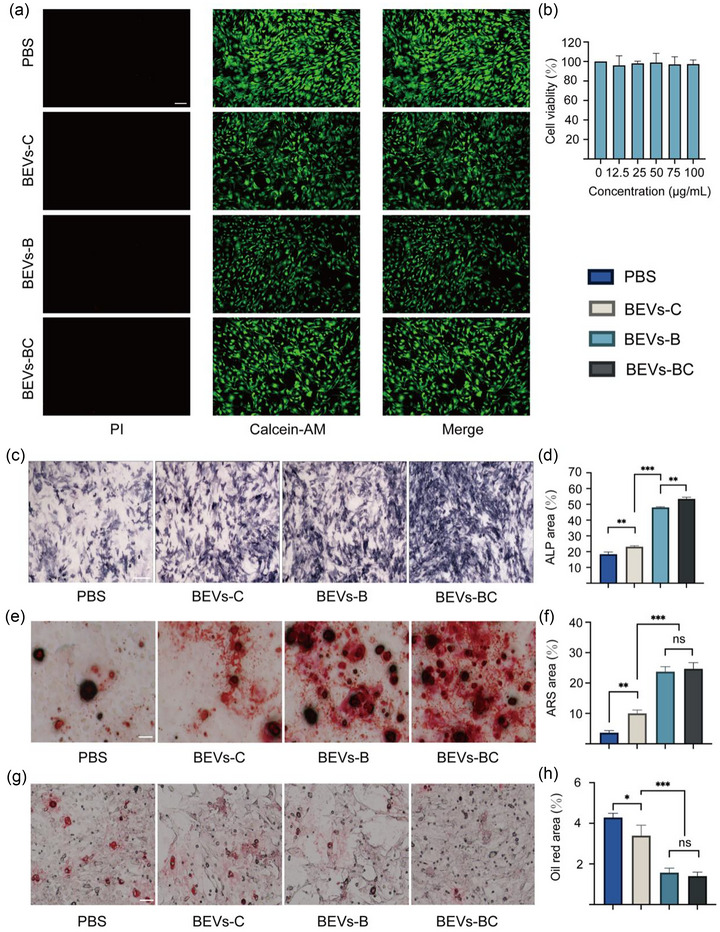
BEVs‐BC promote osteogenic differentiation and inhibit adipogenic differentiation of BMSCs in vitro. (a) Representative D/L staining of BMSCs with PBS, BEVs‐C, BEVs‐B, and BEVs‐BC, n = 3. (b) The potential cytoxicity of BEVs‐CSs in vitro, n = 6. (c) Representative ALP staining of BMSCs after treating with PBS, BEVs‐C, BEVs‐B, and BEVs‐BC, n = 3. Scale bars represent 250 µm. (d) Quantification of ALP staining. (e) Representative ARS staining of BMSCs after treating with PBS, BEVs‐C, BEVs‐B, and BEVs‐BC, n = 3. Scale bars represent 100 µm. (f) Quantitative analysis of ARS staining. (g) Representative Oil Red O staining of BMSCs after treating with PBS, BEVs‐C, BEVs‐B, and BEVs‐BC, n = 3. Scale bars represent 100 µm. (h) Quantitative analysis of Oil Red O staining. *P < 0.05, **P < 0.01, ***P < 0.001.