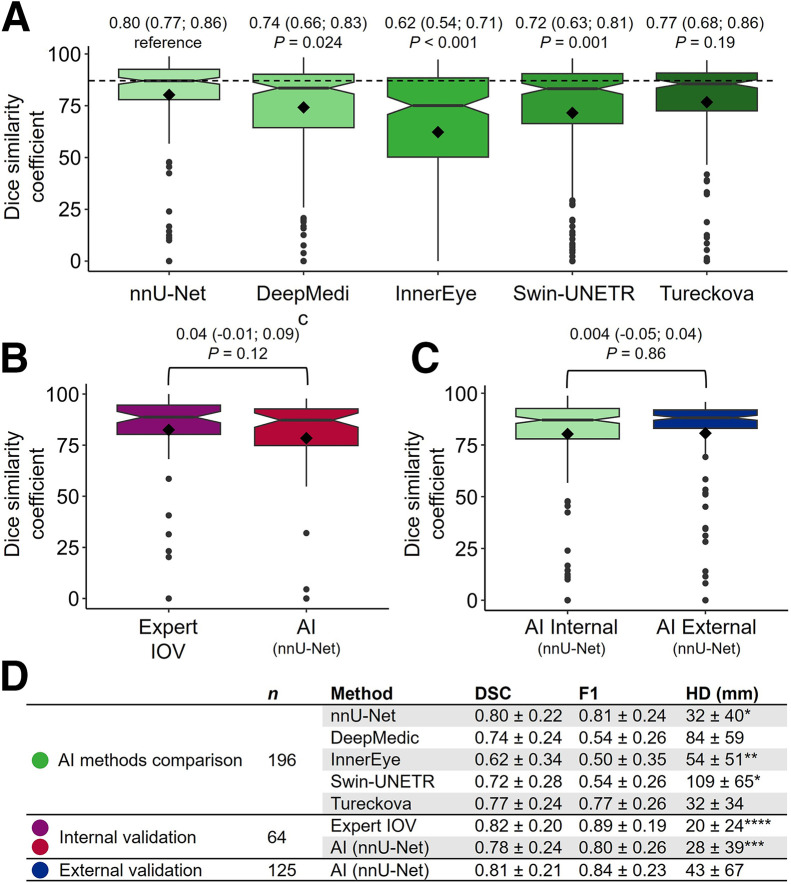
FIGURE 3.
(A) Comparison of 5 implemented methods trained on 196 patient scans based on DSC. Values above boxes are mean followed by 95% CI in parentheses, with P values below. nnU-Net achieved highest DSC and was further analyzed (denoted AI). (B) Paired comparison of AI-to-expert variability and expert IOV on 64 independent internal test scans. (C) Comparison of AI-to-expert variability on 196 internal (same as nnU-Net in A) and 125 external patients. All 3 comparisons used expert-delineated tumor volumes as reference. Values above boxes in B and C are mean difference followed by 95% CI in parentheses, with P values below. Rhombus shape indicates mean value, and central line represents median. Boxes enclose interquartile range. Whiskers extend to most significant measurement no further than 1.5 × interquartile range from hinge. Data beyond whiskers are plotted individually. Notch roughly represents 95% CI around median. (D) DSC, F1 score (F1), and Hausdorff distance (HD) summary statistics in mean ± SD. Hausdorff distance is undefined when expert or AI includes no volume. Hence, numbers marked with *, **, ***, and **** were based on n = 195, 186, 61, and 63, respectively.

