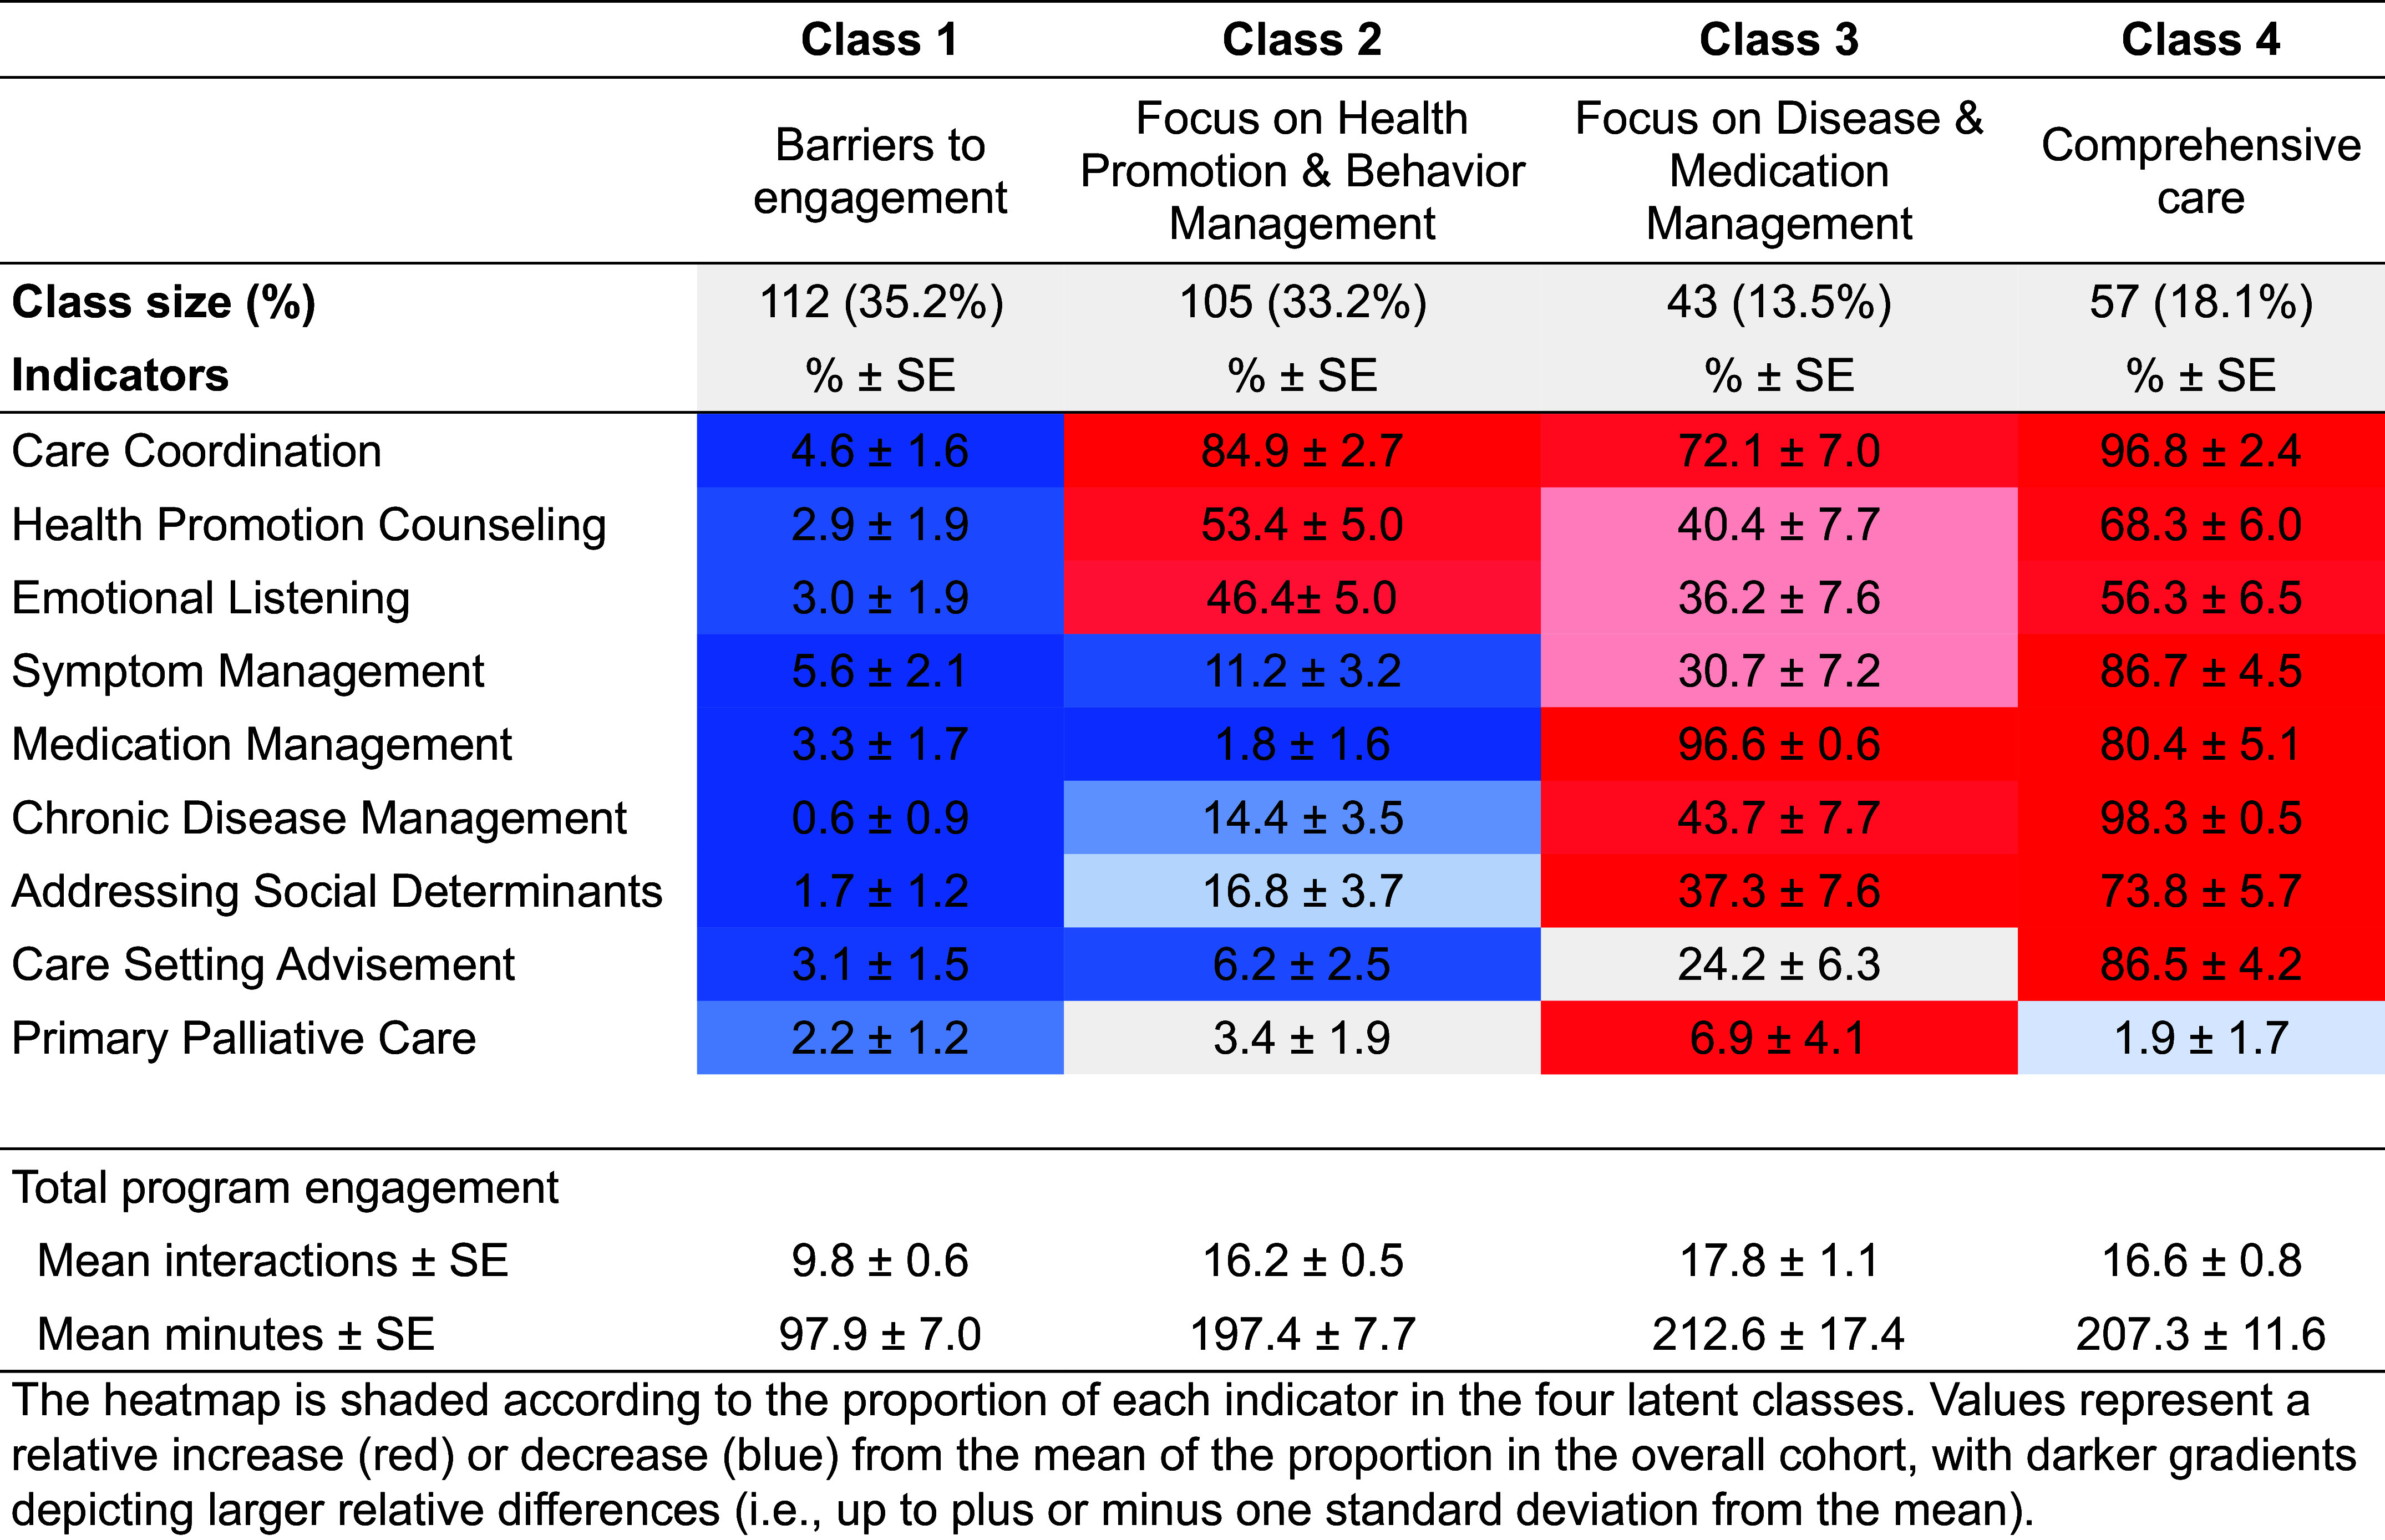
Figure 1.

Heatmap displaying the standardized mean values for receipt of each intervention component indicator across four classes, with description of total program engagement. The heatmap is shaded according to the proportion of each indicator in the four latent classes. Values represent a relative increase (red) or decrease (blue) from the mean of the proportion in the overall cohort, with darker gradients depicting larger relative differences (i.e., up to ±1 standard deviation from the mean). SE = standard error.
