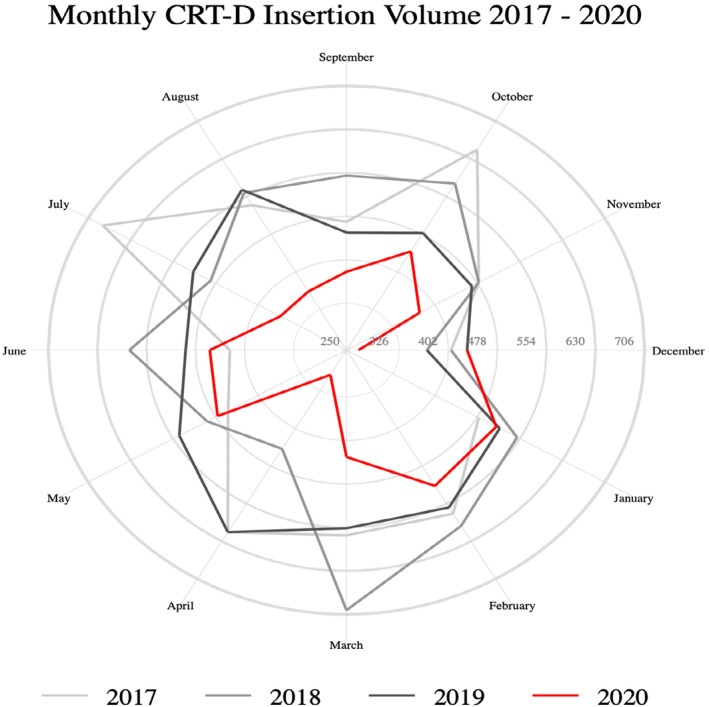
FIGURE 2.

Monthly CRT‐D Implantation. Quantity of CRT‐D implantations by month from 2017 to 2020. CRT‐D implantations broken down by month reveal that there was a significant decline in implantations from February to April 2020, as well as an overall lower number of implantations in the year. The years 2017 to 2019 show a baseline of greater CRT‐D implantations when compared to 2020. source: National inpatient sample
