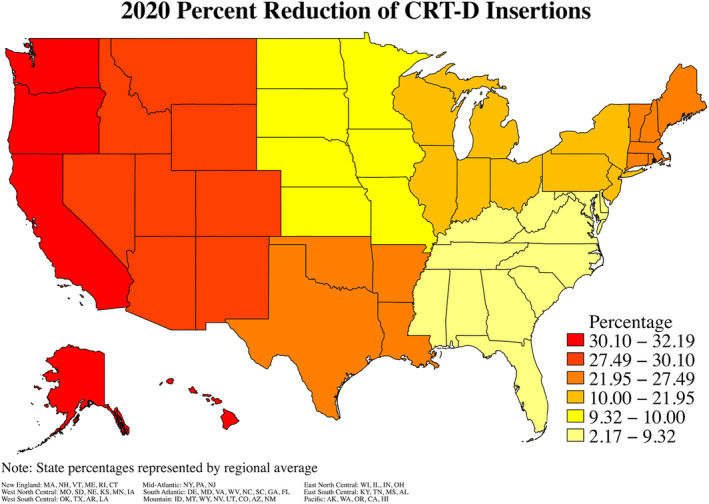
FIGURE 3.

Reduction in CRT‐D Implantation by Region. The percent difference of CRT‐D implantations in 2020 from the average yearly rate between 2017 and 2019 based on the region of the United Statesa. The west region had the greatest reduction in CRT‐D implantation rates, followed by the Central South region. The lowest reduction in implantation rates occurred in the Southeast region. aMade by taking the average insertion total by region from 2017 to 2019, then finding the % difference between that average and the 2020 totals.
