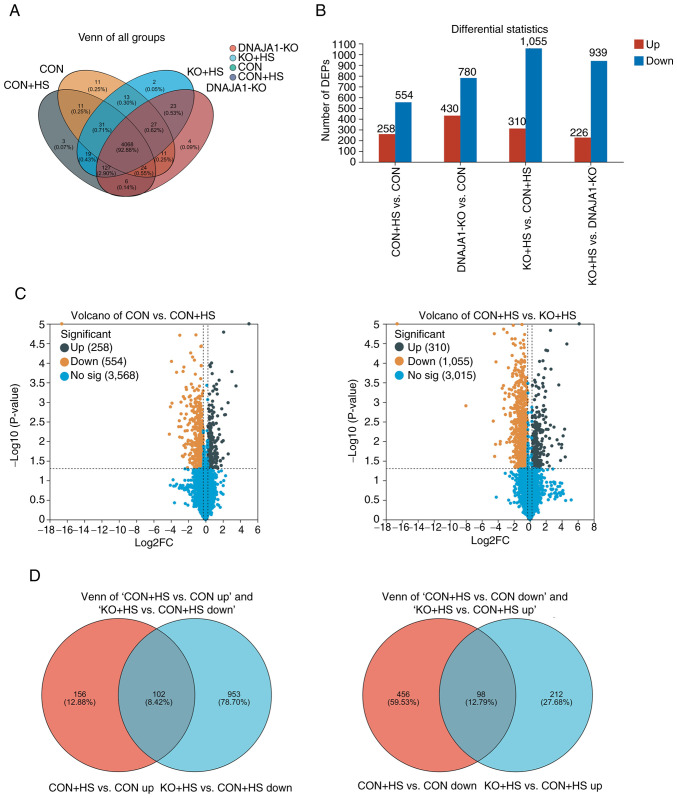
Figure 5.
Analysis of the DEPs in the HUVECs of each group. (A) Venn diagrams indicated the distribution in four groups. (B) Differential statistics showed the DEPs and the number of associated upregulated and downregulated proteins. (C) Volcano maps of the DEPs in CON vs. CON + HS and CON + HS vs. KO + HS groups. (D) Venn diagrams were used to analyze the DEP distribution of upregulated proteins in CON + HS compared to CON cells (CON + HS vs. CON up), and downregulated proteins in KO + HS compared to CON + HS cells (KO + HS vs. CON + HS down); and the DEP distribution of downregulated proteins in CON + HS compared to CON cells (CON + HS vs. CON down), and upregulated proteins in KO + HS compared to CON + HS cells (KO + HS vs. CON + HS up). DEPs, differentially expressed proteins; KO, knockout; HS, heat stroke; CON, control; HUVECs, human umbilical vein endothelial cells; No sig, not significant.

