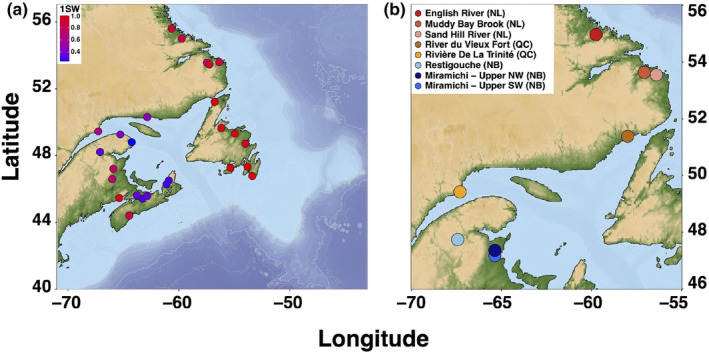
FIGURE 1.

Map locations colored by 1SW proportion from 26 sampled rivers for individuals genotyped on the SNP array (a), and locations from eight sampled rivers for samples with individual sea age genotyped using whole‐genome resequencing (WGS) (b).

Map locations colored by 1SW proportion from 26 sampled rivers for individuals genotyped on the SNP array (a), and locations from eight sampled rivers for samples with individual sea age genotyped using whole‐genome resequencing (WGS) (b).