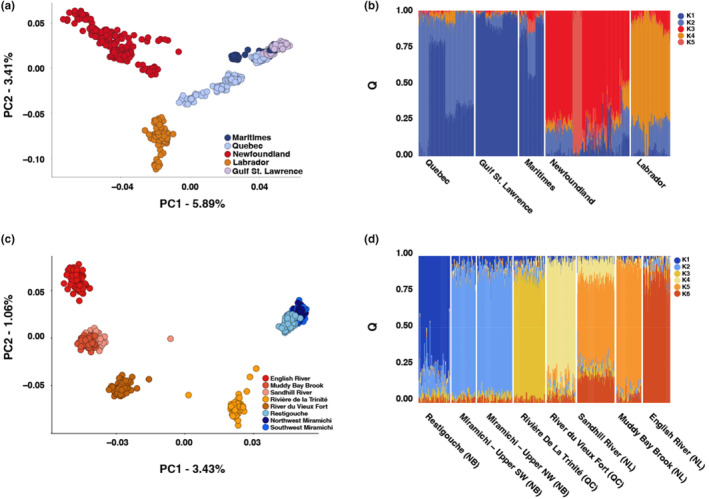
FIGURE 2.

Population structure inferred from principal component (PC) analysis in pcadapt colored by geographic origin (a), individual admixture proportions identified from sparse non‐negative matrix factorization in LEA of individuals genotyped on the SNP array (b), population structure inferred from principal component analysis (c), and admixture proportions across regions identified from non‐negative matrix factorization (d) in PCANGSD using whole‐genome resequencing (WGS) samples.
