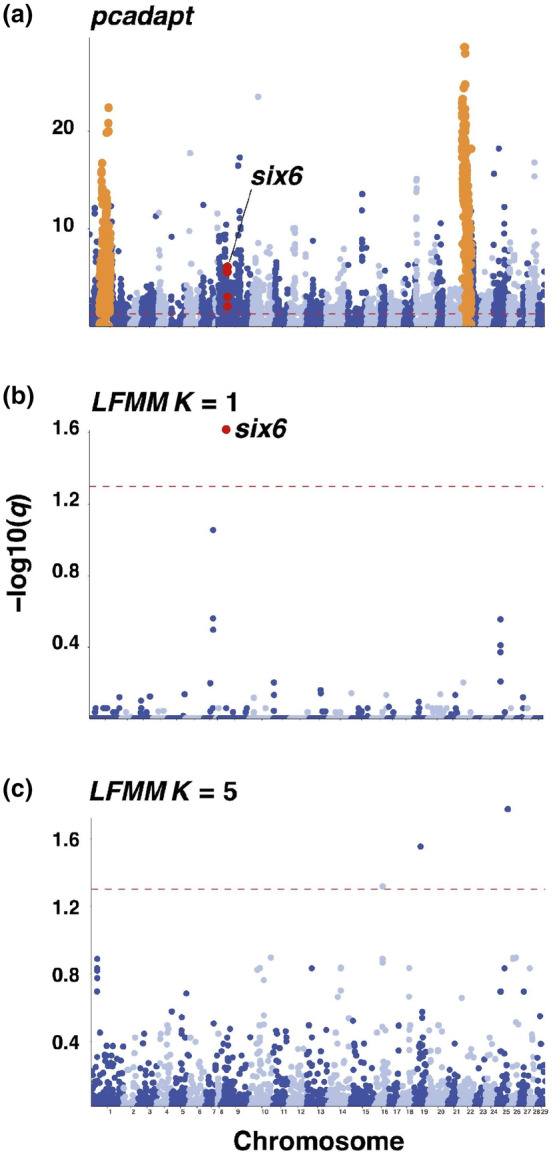
FIGURE 3.

Genome‐wide distribution of Axiom array SNPs exhibiting significant association (red dotted line, q < 0.05) with population structure in pcadapt (a), 1SW proportion in river of origin in LFMM with K = 1 (b) with red circles indicating the location of SNPs within six6, and orange circles indicating location of karyotypic variants identified by Lehnert, Bentzen, et al. (2019).
