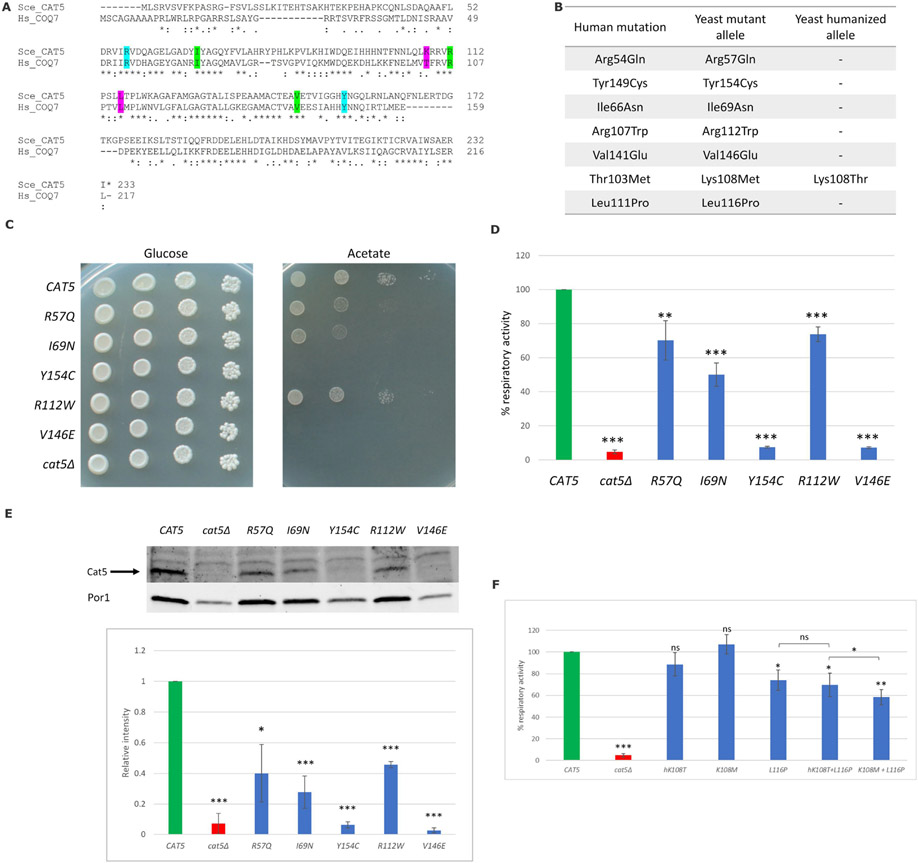
Figure 2. Functional studies of COQ7 variants using a yeast model system.
(A) Alignment (Clustal Omega) of the human COQ7 and the yeast Cat5 proteins. The residues affected in our cohort’s patients are highlighted in cyan, residues affected in previously reported patients are highlighted in green, and two additional residues identified in compound homozygous state in patients are highlighted in pink. Amino acids are indicated as conserved (*), with strongly similar properties (:) or with weakly similar properties (.); (B) Amino acid changes found in the patients and the corresponding humanized and mutant yeast alleles; (C) The cat5Δ strain harboring wild-type, mutant alleles or the empty vector were serially diluted and spotted on SC (without uracil) agar plates supplemented with the fermentable carbon source 2% glucose or the non-fermentable carbon source 2% acetate and incubated at 28°C; (D) Cells were grown at 28°C in SC medium without uracil supplemented with 0.6% glucose. Values are represented as the mean of at least three values ±SD. The green bar indicates the wild-type strain; the blue bars indicate strains carrying the alleged pathological mutations; the red bar indicates the null mutant strain. Statistical analysis was performed using a one-tail paired Student’s t-test: ** p < 0.01, *** p < 0.001; (E) Representative Western blot on total protein extract using an anti-Cat5 polyclonal antibody and anti-Por1 as loading control; signals were first normalized to Porin and then to the wild-type to which the value 1.0 was assigned. Densitometric analysis is reported in the histogram below the blot and was performed on at least three independent blots using Image Lab Software (Bio-Rad). Statistical analyses were performed using a one-tail paired Student’s t-test: * p < 0.05, *** p < 0.001; (F) Cells were grown at 28°C in SC medium without uracil supplemented with 0.6% glucose. Values are represented as the mean of at least three values ±SD. The green bar indicates the wild-type strain; the blue bars indicate strains carrying the humanized allele or the alleged pathological mutations; the red bar indicates the null mutant strain. Statistical analyses were performed using a one-tail paired Student’s t-test: ns: not significant, * p < 0.05, ** p < 0.01, *** p < 0.001. All comparisons are referred to the wild-type unless indicated with brackets.

