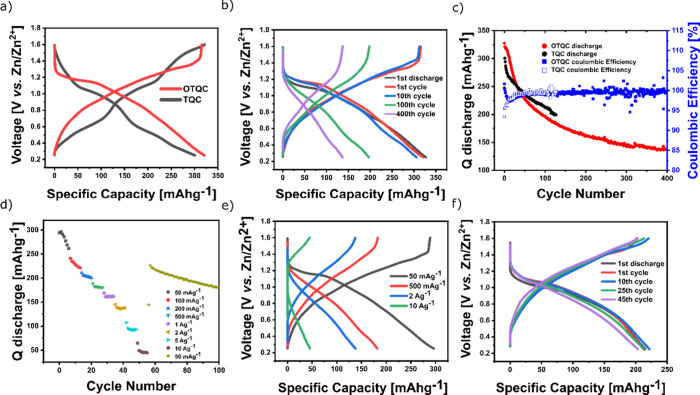
Figure 8.
(a) Comparison of the galvanostatic charge/discharge curves between TQC (black, 2nd cycle) and OTQC (red, 2nd cycle) at 100 mA g–1 in 3 M ZnSO4. (b) Galvanostatic charge/discharge curves of OTQC at 100 mA g–1. (c) Cycling stability of OTQC (red) at 100 mA g–1 and TQC (black) at 50 mA g–1. (d, e) Rate performance of OTQC. (f) Galvanostatic charge/discharge curves of OTQC in 2.2 M Zn(OTf)2 in 70% PEG at 100 mA g–1.

