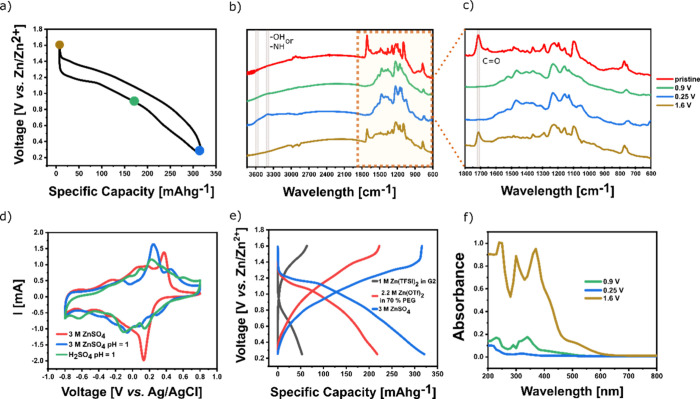
Figure 9.
(a) Voltage profile showing the ex-situ FT-IR spectra sampling points. (b) Ex-situ FT-IR spectra of electrodes in different states of charge: pristine electrode (red), discharged to 0.9 V (green), discharged to 0.25 V (blue), and recharged to 1.6 V (brown). (c) Zoomed-in ex-situ FT-IR insert of electrodes in different states of charge. (d) CV curves of OTQC measured by a three-electrode system at 10 mV s–1 in 3 M ZnSO4 (pH = 3.7) (red), 3 M ZnSO4 + H2SO4 (pH = 1) (blue), and H2SO4 (pH = 1) green. (e) Galvanostatic charge/discharge curves of OTQC in different electrolytes including 1 M Zn(TFSI)2 in G2 (black, 5th cycle), 2.2 M Zn(OTf)2 in 70% PEG (red, 2nd cycle), and 3 M ZnSO4 (blue, 2nd cycle). (f) Ex-situ UV–vis spectrum of electrodes submerged in 3 M ZnSO4 at different states of charge: discharged to 0.9 V (green), discharged to 0.25 V (blue), and charged to 1.6 V (brown).

