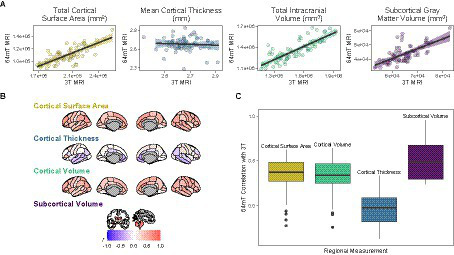
Figure 2.

Correspondence between standard low-field (64mT) and high-field (3T) MR images. (A) Scatterplots of relationships between low-field and high-field images for global brain measures. Data points represent global estimates for each individual. Shading denotes 95% confidence intervals. (B) Pearson correlations for relationships between low-field and high-field images at the regional level. Shading represents mean correlation within each region across all individuals. (C) Distribution of correlation strengths for relationships between standard low-field and high-field images across each brain measure. Data points represent mean correlation across each region of interest.
