
Figure 3.
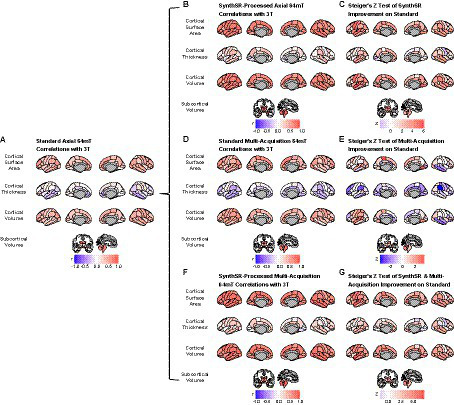
Comparison of super-resolution approaches in improving correspondence between low-field and high-field MR images. (A) Correlation of standard single-acquisition low-field images with high-field images for surface area, cortical volume, cortical thickness and subcortical volume. (B) Correlation of SynthSR-processed, single-acquisition low-field images with high-field images. (C) Steiger Z-test values for change in correspondence between standard and SynthSR-processed data. (D) Correlation of multi-orientation standard low-field images with high-field images. (E) Steiger Z-test values for change in correspondence between single-acquisition and multi-orientation approaches. (F) Correlation of SynthSR-processed, multi-orientation low-field images with high-field images. (G) Steiger Z-test values for change in correspondence between single-acquisition standard low-field images and multi-orientation, SynthSR-processed low-field images.