
Figure 4.
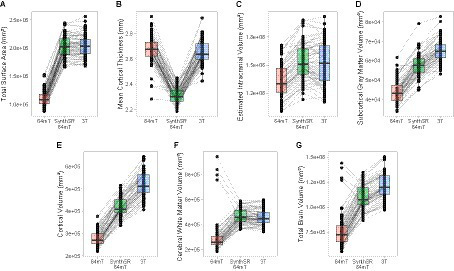
Comparison of individual-level global measurements across standard 64mT axial scans, SynthSR-processed 64mT axial scans, and traditional 3T scans. Boxplots show individual estimates for global brain measures (A–G) derived from standard axial 64mT scans (64mT), SynthSR-processed axial 64mT scans (SynthSR 64mT) and 3T scans (3T). Gray lines connect the same individuals across the three approaches.