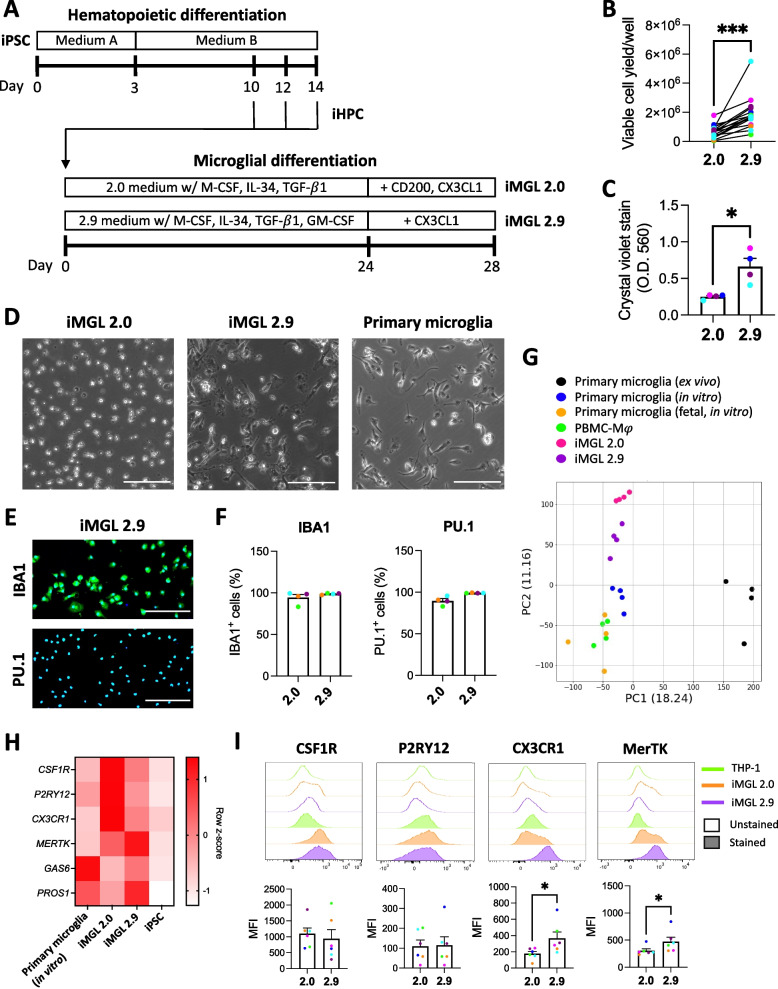
Fig. 1.
Characterization of iMGL 2.9. A Schematic of the 2.0 and 2.9 protocols. B-H iMGL 2.0 and 2.9 differentiation were carried out side-by-side from the same healthy control iPSC lines. B Viable iMGL cell yield assessed by trypan blue exclusion assay. Cell numbers per well of a 6-well plate are presented. A t-test was performed. n = 13 differentiation batches from 6 iPSC lines. *** p < 0.001. Connecting lines show side-by-side experiments. C Crystal violet assay. A Mann–Whitney test was performed. n = 4 lines, * p < 0.05, O.D. = optical density. D Phase contrast images of iMGL 2.0, iMGL 2.9 and primary human microglia. Scale bar = 150 . E Representative images of IBA1 and PU.1 immunostaining. Blue = Hoechst 33342, green = IBA1 or PU.1, scale bar = 200 μm. F Quantification of IBA1- and PU.1-immunopositivity. n = 4 lines. G PCA plot of RNA-sequencing data. H Heatmap showing key microglia marker expression assessed by qRT-PCR. n = 4 donors for primary microglia, 6 lines for iMGL 2.0/2.9 and iPSCs. I Flow cytometry assessment of cell surface microglia marker expression in iMGL 2.0 and 2.9. Data from THP-1 cells are shown as negative controls. Mann–Whitney tests were performed. n = 6 lines, * p < 0.05. MFI = median fluorescence intensity

