Fig. 2.
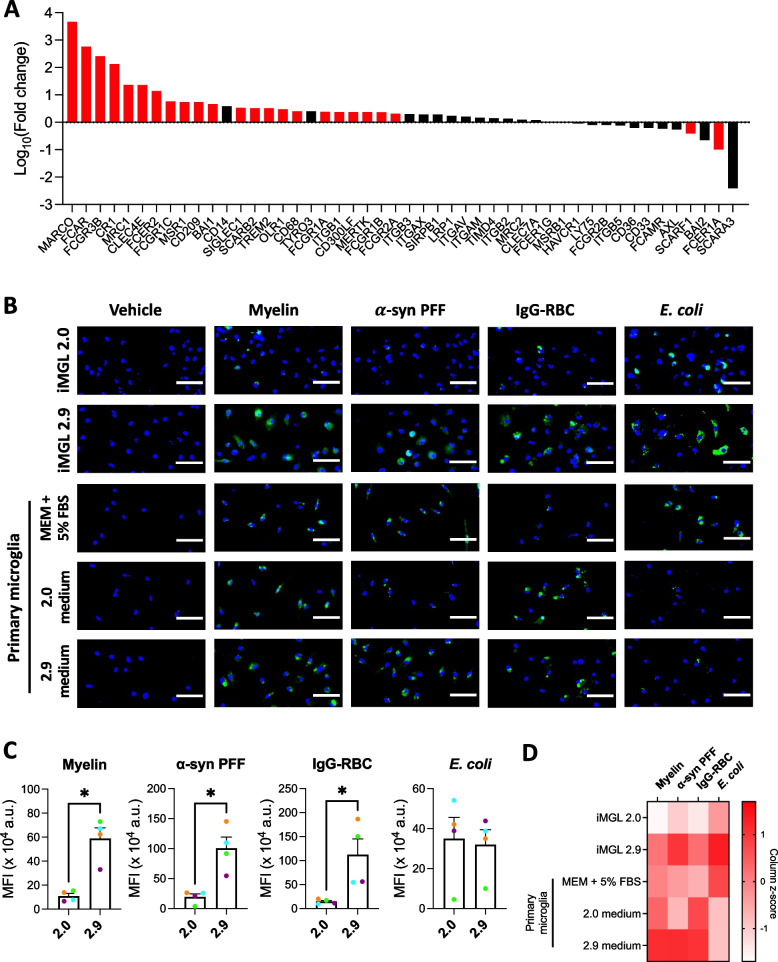
Scavenging abilities of iMGL 2.9. iMGL 2.0 and 2.9 were differentiated side-by-side from the same healthy control iPSC lines. A Expression of genes encoding phagocytosis/scavenger receptors or positive regulators of phagocytosis in iMGL 2.9 compared to 2.0. Red bars represent genes that were significantly different (adjusted p < 0.05) between iMGL 2.0 and 2.9 whereas black bars represent genes that were not significantly different. n = 4 lines. B-D iMGL 2.0, iMGL 2.9 and primary human microglia were treated side-by-side with vehicle or pHrodo™ Green-labelled myelin, α-synuclein preformed fibrils (α-syn PFF), opsonized red blood cells (IgG-RBC) or E. coli for three hours and then counterstained with Hoechst 33342. B Representative fluorescence images. Scale bar = 50 . C-D Quantification of mean green fluorescence intensity (MFI) per cell. Mann–Whitney tests were performed in C. n = 4 lines, * p < 0.05 in C. Average values from n = 2 lines (iMGL) or donors (primary microglia) are presented in D

