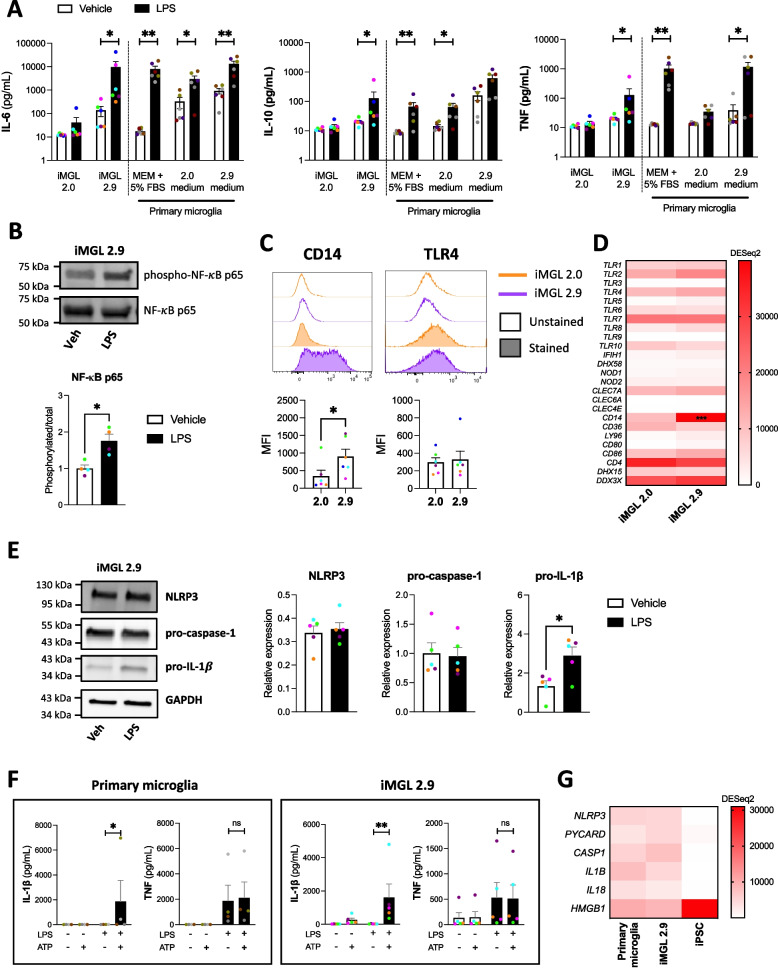
Fig. 3.
TLR4 signaling response of iMGL 2.9 following LPS treatment. iMGL 2.0 and 2.9 were differentiated side-by-side from the same healthy control iPSC lines. A IL-6, TNF and IL-10 concentrations in supernatants from iMGL 2.0, iMGL 2.9 and primary human microglia treated with vehicle or LPS (100 ng/mL) for 24 h. Mann–Whitney tests were performed. n = 5 lines for iMGL, n = 6 donors of primary microglia, * p < 0.05, ** p < 0.01, *** p < 0.001. B Representative Western blotting and quantification of NF-κB in iMGL 2.9 treated with vehicle or LPS (100 ng/mL) for 1.5 h. A Mann–Whitney test was performed. n = 4 lines, * p < 0.05. C Flow cytometry assessment of cell surface CD14 and TLR4 expression in iMGL 2.0 and 2.9. Mann–Whitney tests were performed. n = 6 lines, * p < 0.05. D Heatmap showing expression of genes encoding pattern recognition receptor and their co-receptors. A two-way ANOVA was performed. n = 4 lines, *** p < 0.001 vs iMGL 2.0. E Representative Western blotting and quantification of inflammasome components in iMGL 2.9 treated with vehicle or LPS (100 ng/mL) for 24 h. Mann–Whitney tests were performed. n = 5 lines, * p < 0.05. F IL-1β and TNF concentrations in cell supernatants of human primary microglia and iMGL 2.9 treated with vehicle or LPS (100 ng/mL) for 24 h, followed by ATP (5 mM) or not for 30 min. Kruskal–Wallis tests followed by Dunn’s multiple comparison tests were performed. n = 4 donors of primary microglia and n = 5 lines for iMGL, * p < 0.05, ** p < 0.01, ns = non-significant. G Heatmap showing the expression of genes encoding NLRP3 inflammasome components and their substrates. n = 4 donors of primary microglia, 4 lines for iMGL and iPSCs

