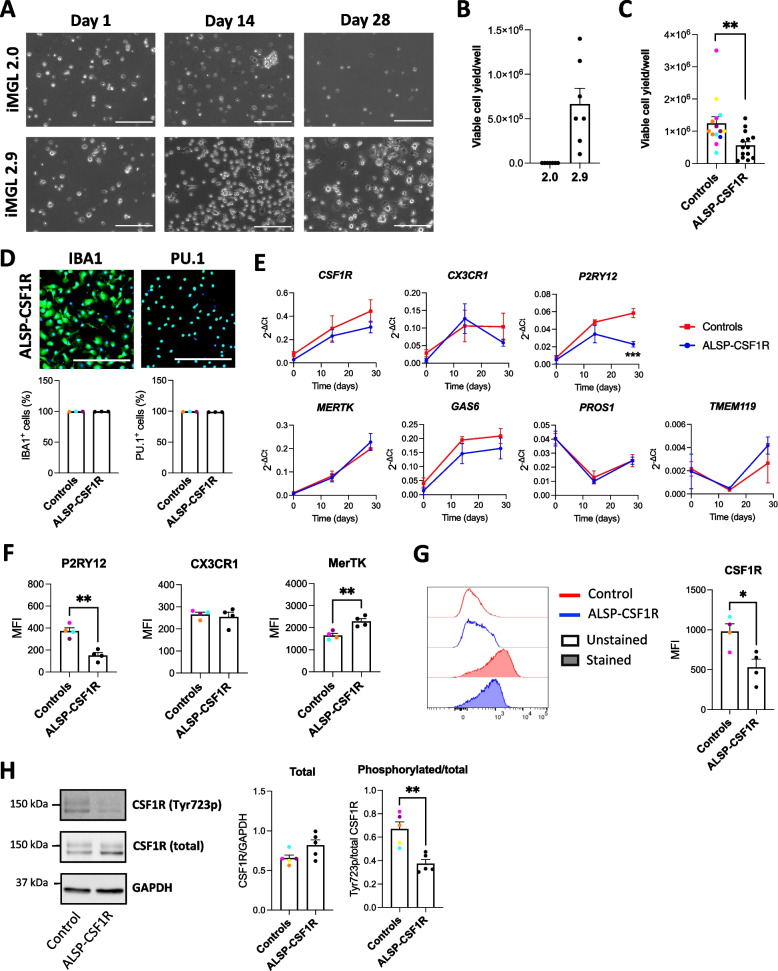
Fig. 5.
Derivation of microglia-like cells from the ALSP-CSF1R patient with a c.2350G > A (p.V784M) CSF1R variant. A Phase contrast images of ALSP-CSF1R iPSC line differentiated into iMGL using the 2.0 or 2.9 protocol. Scale bar = 150 . B Viable cell yield per well of a 6-well plate assessed by trypan blue exclusion assay following 2.0 and 2.9 differentiation of the ALSP-CSF1R iPSCs into iMGL. n = 7 differentiation batches. C Viable cell yield per well of a 6-well plate assessed by trypan blue exclusion assay following side-by-side differentiation of healthy control lines (n = 14 differentiation batches from 6 lines) and the ALSP-CSF1R line (n = 14 differentiation batches) using the 2.9 protocol. A t-test was performed, * p < 0.05. (D) Quantification of IBA1- and PU.1-immunopositivity. n = 4 healthy control lines and 4 batches of a single ALSP-CSF1R line, differentiated side-by-side using the 2.9 protocol. E qRT-PCR assessment of microglia marker expression on day 0, 14 and 28 of microglial differentiation. n = 4 healthy control lines and 4 batches of a single ALSP-CSF1R line, differentiated side-by-side using the 2.9 protocol. Two-way ANOVA were performed, followed by Sidak’s post hoc tests. *** p < 0.001. F Flow cytometry assessment of P2RY12, CX3CR1 and MerTK cell surface expression. T-tests were performed. n = 4 healthy control lines and 4 batches of a single ALSP-CSF1R line, differentiated side-by-side using the 2.9 protocol. ** p < 0.01. G Flow cytometry assessment of CSF1R cell surface expression. A t-test was performed. n = 4 healthy control lines and 4 batches of a single ALSP-CSF1R line, differentiated side-by-side using the 2.9 protocol. * p < 0.05. H Western blot assessment of CSF1R and its tyrosine 723-phosphorylated form, and GAPDH. A t-test was performed. n = 5 healthy control lines and 5 batches of a single ALSP-CSF1R line, differentiated side-by-side using the 2.9 protocol. ** p < 0.01

