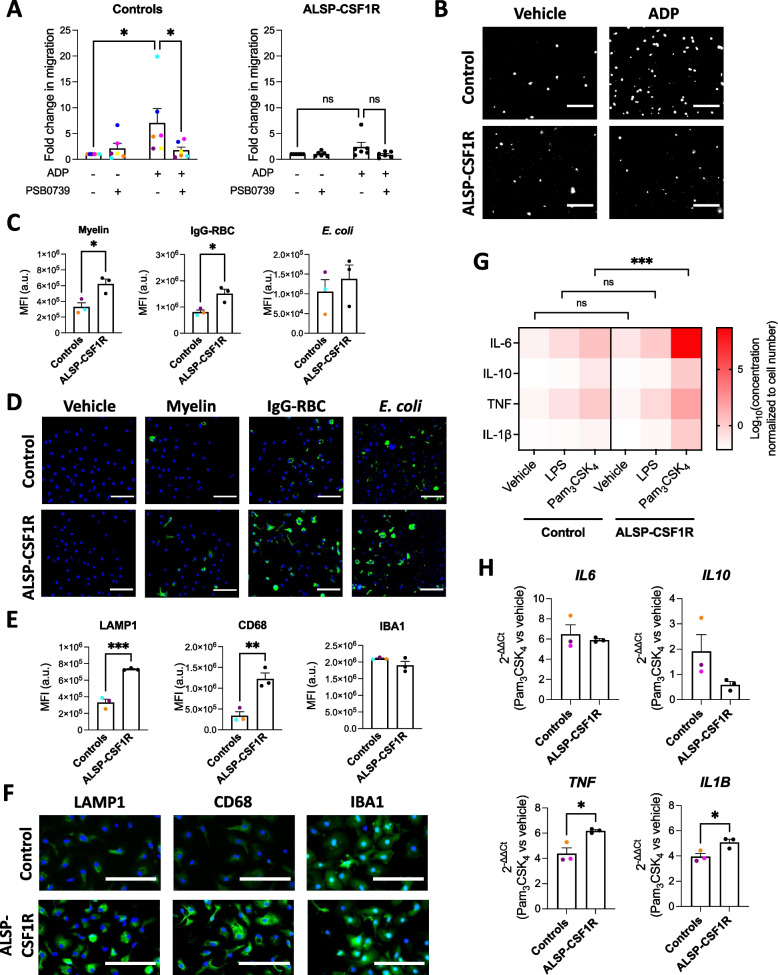
Fig. 6.
Functional phenotype of iMGL derived from the ALSP-CSF1R patient with a c.2350G > A (p.V784M) CSF1R variant. All iMGL were generated using the 2.9 protocol. Quantification (A) and images (B) of iMGL migratory activity toward ADP assessed by Boyden chamber assay. Cells were concomitantly treated or not with PSB0739. Kruskal–Wallis tests followed by Dunn’s multiple comparison tests were performed. n = 6 healthy control lines and 6 batches of a single ALSP patient line, differentiated side-by-side. White = Hoechst 33342, scale bar = 75 μm in (B). Quantification of green fluorescence intensity per cell (C) and representative images (D) of iMGL exposed to vehicle or pHrodo.™ Green-labelled myelin, opsonized red blood cells (IgG-RBC) or E. coli for three hours and then counterstained with Hoescht 33342. T-tests were performed. n = 3 healthy control lines and 3 batches of a single ALSP patient line, differentiated side-by-side, * p < 0.05. Scale bar = 250 in (D). Quantification of mean fluorescence intensities (MFI; E) and representative images (F) of LAMP1, CD68 and IBA1 immunostaining of iMGL. T-tests were performed. n = 3 healthy control lines and 3 batches of a single ALSP patient line, differentiated side-by-side, ** p < 0.01, *** p < 0.001. Scale bar = 100 in (F). G Cytokine secretion assessed in cell supernatants following a 24-h treatment with vehicle, LPS (100 ng/mL) or Pam3CSK4 (100 ng/mL). A two-way ANOVA was performed, followed by Tukey’s post hoc test. n = 4 healthy control lines and 4 batches of a single ALSP patient line, differentiated side-by-side, *** p < 0.001, ns = non-significant. H qRT-PCR performed after three hours of Pam3CSK4 (100 ng/mL) vs. vehicle treatment. T-tests were performed. n = 3 healthy control lines and 3 batches of a single ALSP patient line, differentiated side-by-side, * p < 0.05

